Exercise 1: Health site distribution in the Saint Louis region#
Characteristics of the exercise#
Aim of the exercise
Become familiar with different types of spatial analysis and geoprocessing tools. Understand the process of discovering relationships and connections between features in spatial data.
Type of trainings exercise:
This exercise can be used in online and presence training.
It can be done as a follow-along exercise or individually as a self-study.
Focus group (GIS-Knowledge Level)
These skills are relevant for
Estimated time demand for the exercise.
Relevant Wiki Articles
Instructions for the trainers#
Trainers Corner
Prepare the training
Take the time to familiarise yourself with the exercise and the provided material.
Prepare a white-board. It can be either a physical whiteboard, a flip-chart, or a digital whiteboard (e.g. Miro board) where the participants can add their findings and questions.
Before starting the exercise, make sure everybody has installed QGIS and has downloaded and unzipped the data folder.
Check out How to do trainings? for some general tips on training conduction
Conduct the training
Introduction:
Introduce the idea and aim of the exercise.
Provide the download link and make sure everybody has unzipped the folder before beginning the tasks.
Follow-along:
Show and explain each step yourself at least twice and slow enough so everybody can see what you are doing, and follow along in their own QGIS-project.
Make sure that everybody is following along and doing the steps themselves by periodically asking if anybody needs help or if everybody is still following.
Be open and patient to every question or problem that might come up. Your participants are essentially multitasking by paying attention to your instructions and orienting themselves in their own QGIS-project.
Wrap up:
Leave time for any issues or questions concerning the tasks at the end of the exercise.
Leave some time for open questions.
Data#
Download the datasets here and unzip the files.
Hint
All files still have their original names. However, feel free to modify their names if necessary to identify them more easily.
Task#
The goal of this exercise will be to assess the health site distribution in the Saint Louis region in Senegal and determine which health sites are prone to flooding.
Hint
The projected coordinate system for Senegal is EPSG:32628 WGS 84 / UTM zone 28N
Load the health sites layer (
sen_healthsites.shp) and the administrative boundary data (sen_admbnda_adm1_1m_gov_ocha_20190426.shp) into your QGIS project. Add OpenStreetMap as a background layer (Hint: XYZ via the browser window or the QuickMapServices plugin).
Attention
Always make sure that your datasets are provided in the correct projection. If this it not the case, it is necessary to reproject the data in the desired coordinates reference system. See the Wiki entry on projections for further information.
Select all health sites which are located within the Saint Louis region:
Select the region
Saint Louisin the boundary layer. You can just manually select the specific rows. See the Wiki entry on spatial queries for further information.Save the selection under the new name
Saint_Louis_regionin an extra layer. This can be done by right clicking on the boundary layer –>Export–>Save Selected Features As...
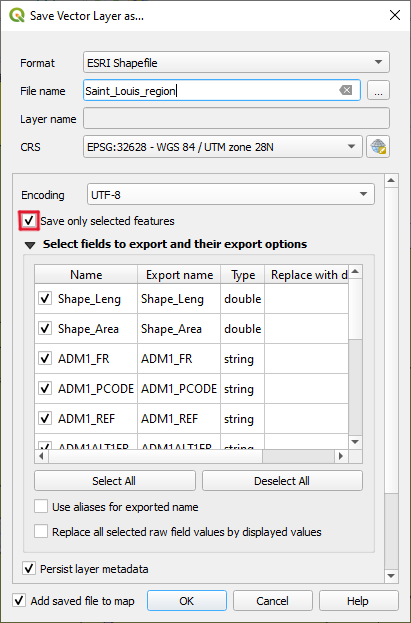
Screenshot of how to export selected features#
Use the

Select by locationor
Cliptool to select all health facilities within theSaint_Louis_regionlayer.Save the new selection under the new name
healthsites_Saint_Louisin an extra layer (Hint: right click on layer, Export, …).
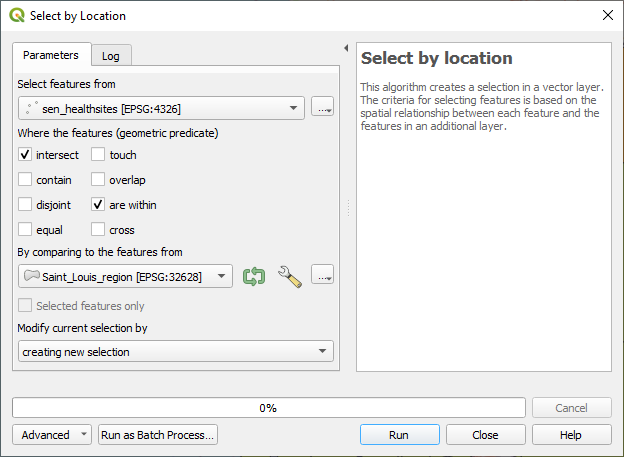
Screenshot of the select by location tool#
Investigate the flood risk in Saint Louis. Following the successful selection of all health sites in the Saint Louis region in the previous step, proceed to load the flood extent layer of Saint Louis into QGIS:
Add the flood extent layer (
EO4SD_SAINT_LOUIS_FLOOD_2018.shp)While the layer does not cover the entirety of the Saint Louis region, it extends beyond Saint Louis in the north. Use the
Cliptool to clip the flood extent layer to the Saint Louis region (Hint: as input use Saint Louis flood extent, use Saint_louis_region as the overlay) for a more concentrated focus on central Saint Louis. See the Wiki entry on Geoprocessing for further information.Save the selection as
Saint_Louis_flood_clipped.
When looking at the attribute table of the
Saint_Louis_flood_clippedlayer (Watertype column), you will see that the layer includes flooded, non-flooded and water body areas.
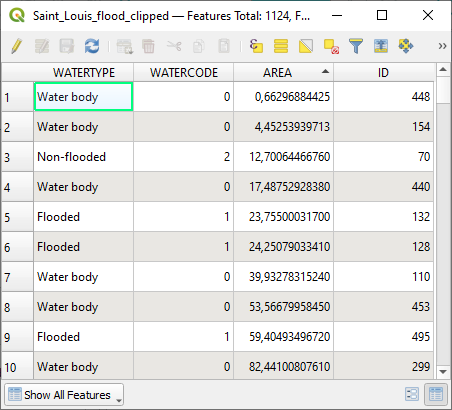
Screenshot of the Saint_Louis_flood_clipped layer#
Visualize only the flooded areas and water bodies in the dataset:
Go into
Symbologyand change the first selection from “Single symbols” toCategorized.Select the column
Watertypeand clickClassify.Choose different colors for both the water bodies and the flooded areas. Leave non-flooded areas unmarked or make them transparent (opacity = 0%).
Visual exploration: Which areas are more and less prone to flooding?

Screenshot of the water bodies and flooded areas#
Assess which health sites are prone to flood risk.
Make use of the
Select by expressiontool to select all flooded areas in theSaint_Louis_flood_clippedlayer. You can access this tool through the attribute table by clicking on this symbol
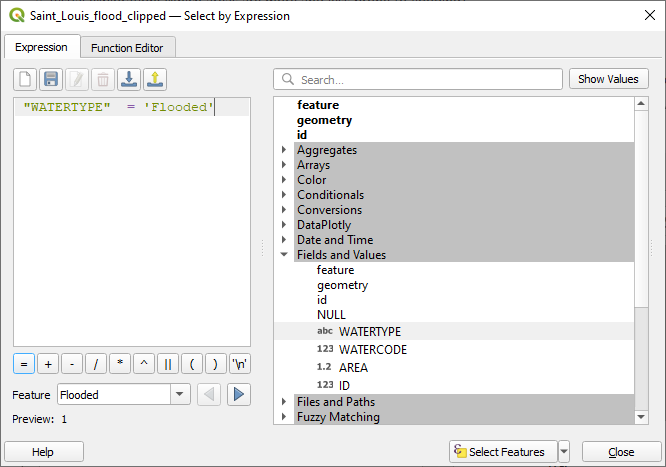
Screenshot of the Select by expression tool#
Save the selection in a separate layer. Name it
Saint_Louis_flooded_areas.You can now remove the
Saint_Louis_flood_clippedlayer to avoid confusion.Make use of the
Select by locationtool to assess which health sites are prone to flooding because they are located within the flooded areas in Saint Louis (Hint: Select features from:healthsites_Saint_Louis; By comparing to:Saint_Louis_flooded_areas).
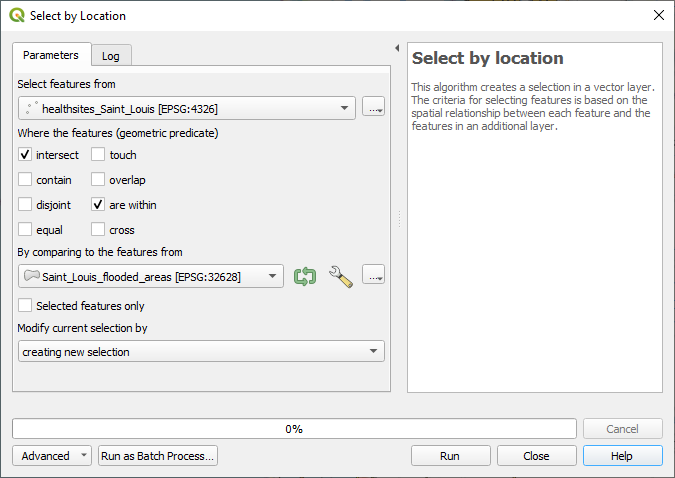
Screenshot of the Select by location tool#
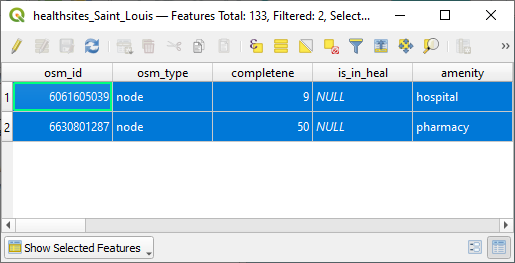
Check the attribute table of the
healthsiteslayer for the selected features were one pharmacy and one hospital should be selected.
Screenshot of the selected health sites in the flooded areas#
Which health sites are located close to flooded zones?
Create a
 buffer around the health sites in Saint Louis with a distance of
 20 meters. See the Wiki entry on Geoprocessing for further information.
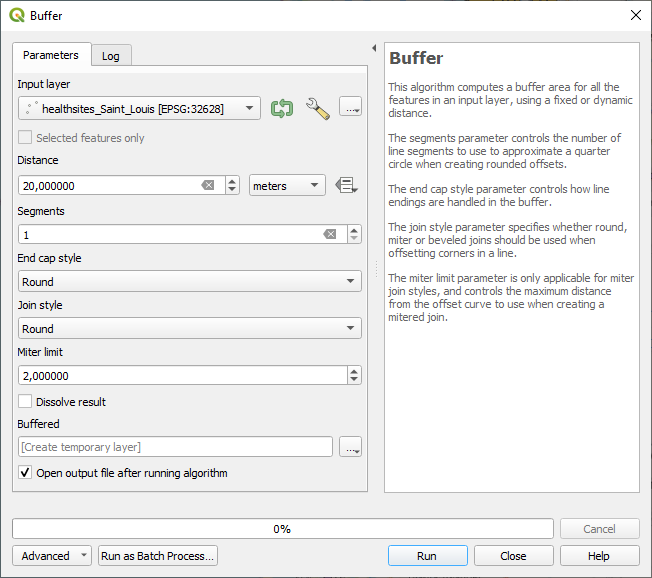
Screenshot of the buffer process#
Hint
At this stage at the latest, you will be reminded to reproject your layers. Meaningful buffers can only be calculated in projected coordinate systems. The projected coordinate system for Senegal is EPSG:32628 WGS 84 / UTM zone 28N
Now make use of the
Select by locationtool again to assess which buffers intersect with the flooded areas.
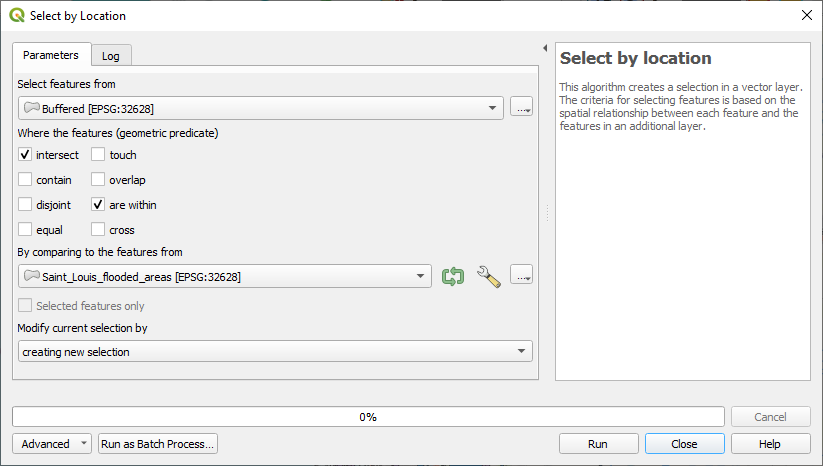
Screenshot of the Select by location tool for the buffered areas#
How many health sites are selected? Check the attribute table. The selection should include five pharmacies and one hospital.
Feel free to experiment with additional buffer distances.
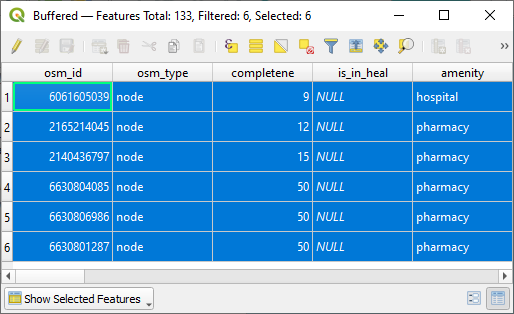
Screenshot of the buffered and selected health sites in the flooded areas#
The final result may be represented as follows: it will display the flooded areas, the buffered health sites, and the intersections between them. While these features might not be easily visible in QGIS, you can verify that everything worked correctly by checking the attribute table.
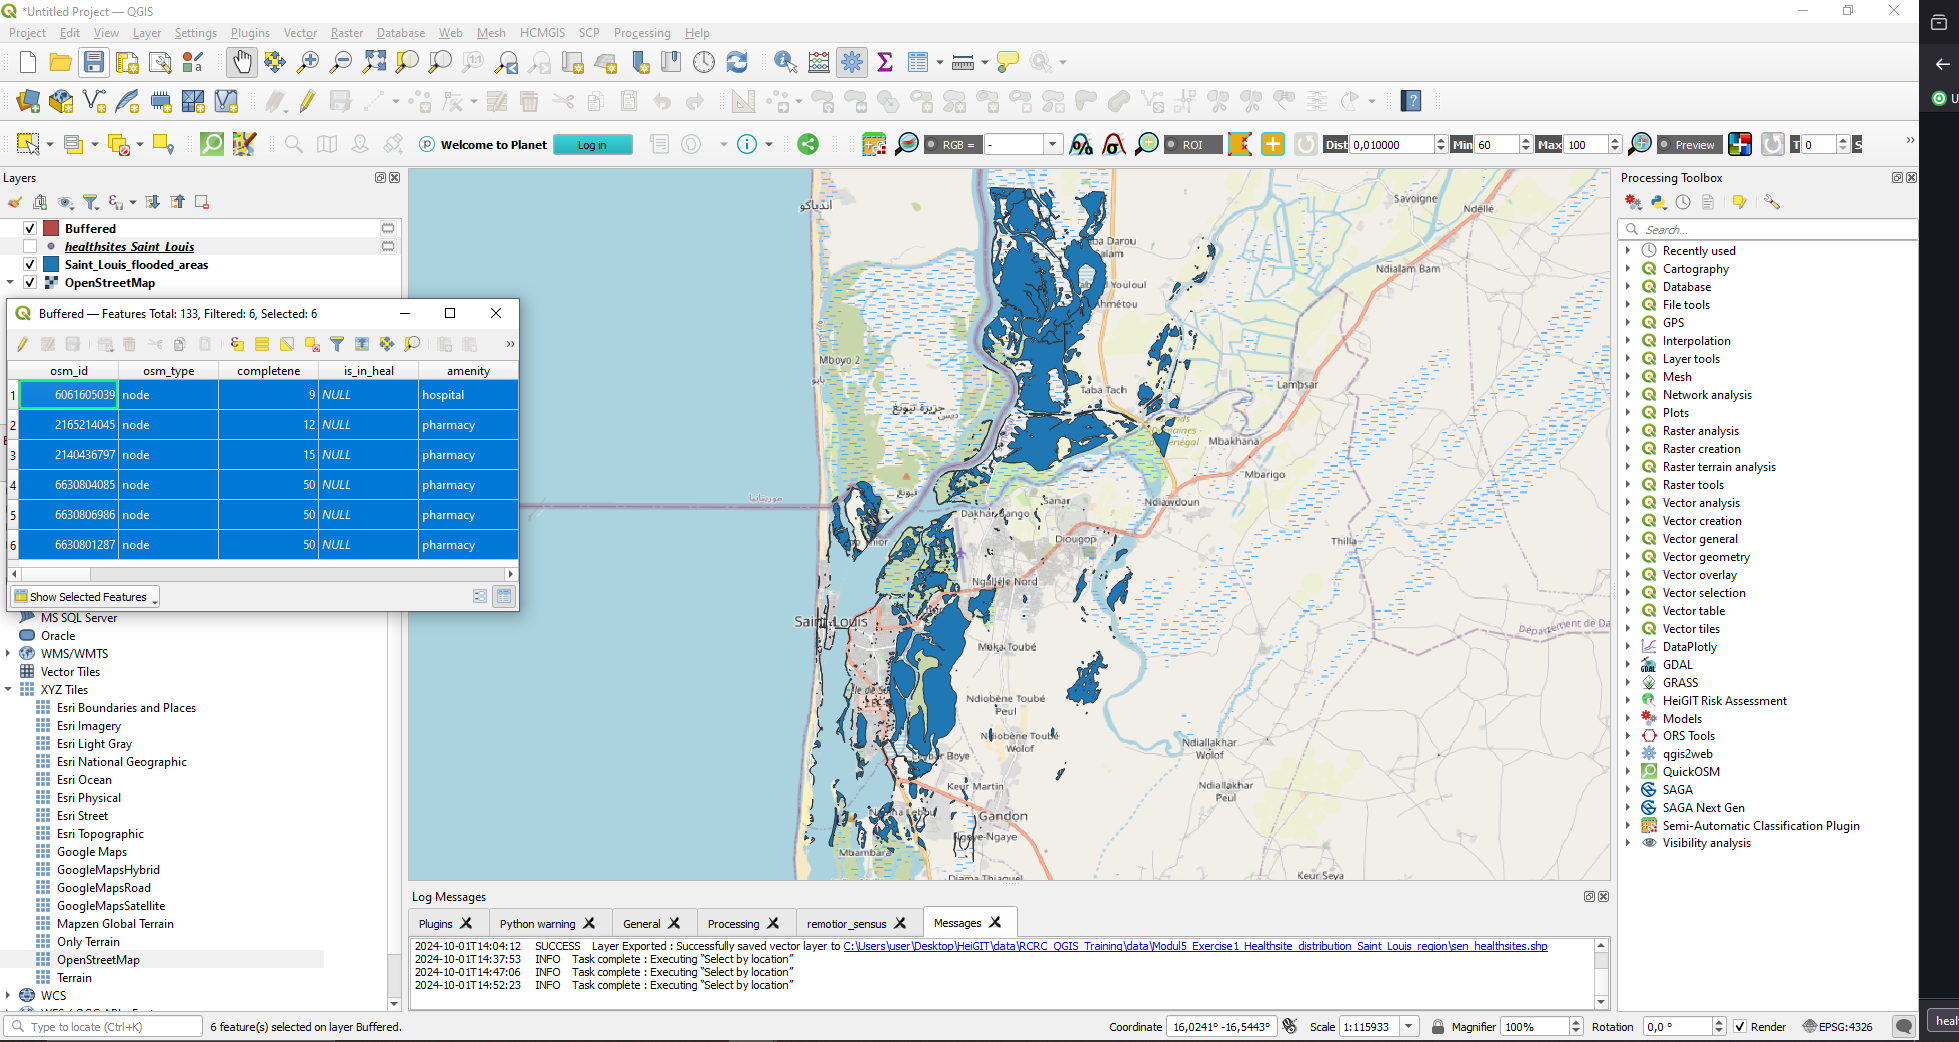
Screenshot of the final result#