Remote Sensing and Raster data theory 🛰️#
🚧This training platform and the entire content is under ⚠️construction⚠️ and may not be shared or published! 🚧
What is Raster Data#
Raster data is next to vector data a fundamental component of GIS and represents spatial information as a rectangular grid of cells or pixels that are each associated with a specific geographical information. Each cell contains a value representing a certain attribute, such as elevation, temperature or land cover within a specific area. Regarding their structure geospatial rasters are very similar the representation of optical information in a digital picture, the different beeing that a geospatial raster is accompanied by spatial information that connects the data to a particular location.
The data format raster data is particularly useful for capturing continuous phenomena across a geographical area such as temperature or elevation that do not suit the visualization with vector geometries due to their continuous nature without clear boundaries.
In each raster cell information is stored with a value that can be interpreted in the context of the attribute/phenomenen the raster expresses, for example elevation in meters or colour intensity in case of an image.
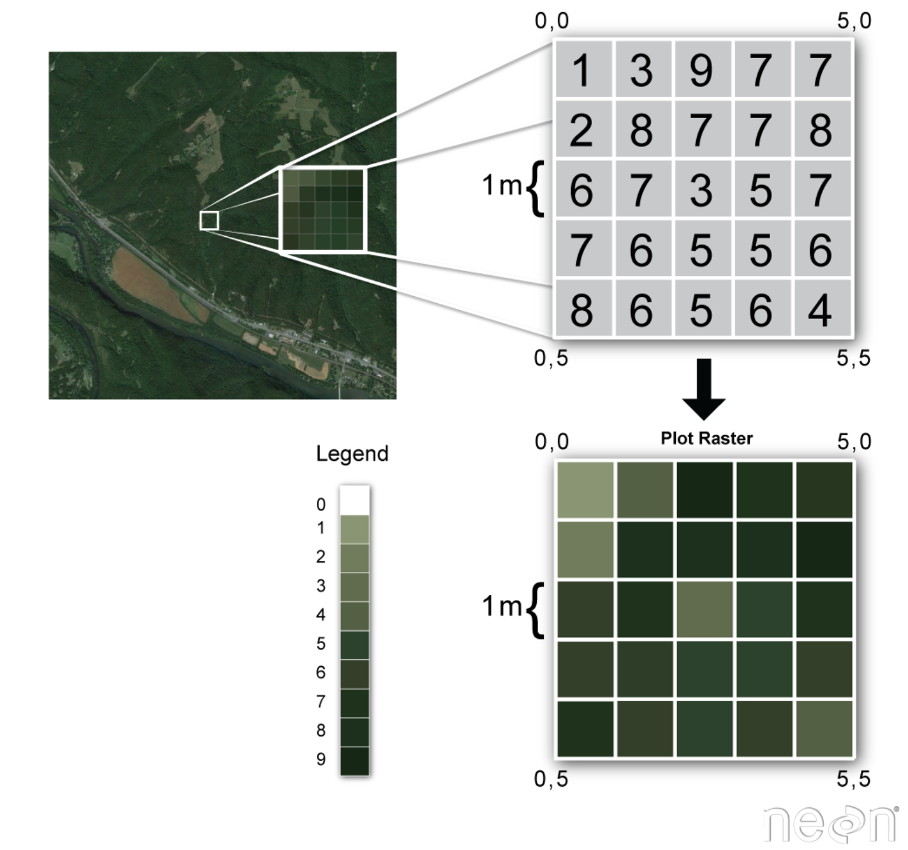
Fig. 163 Basic concept of a spatial raster#
Types of Raster Data#
Raster data can be distinguished intwo two common types according to the type of information that is displayed: Continous and catigoral raster data.
Continuous raster data refers to datasets where the values assigned to each pixel represent continuous phenomena that vary smoothly across the area covered by the raster. Some examples of continuous rasters include:
Precipitation Maps displaying variable precipitation sums
Digital Elevation Models containing altidute values
Spatially variable Indices such as the Normalized Difference vegetation Index (NDVI)
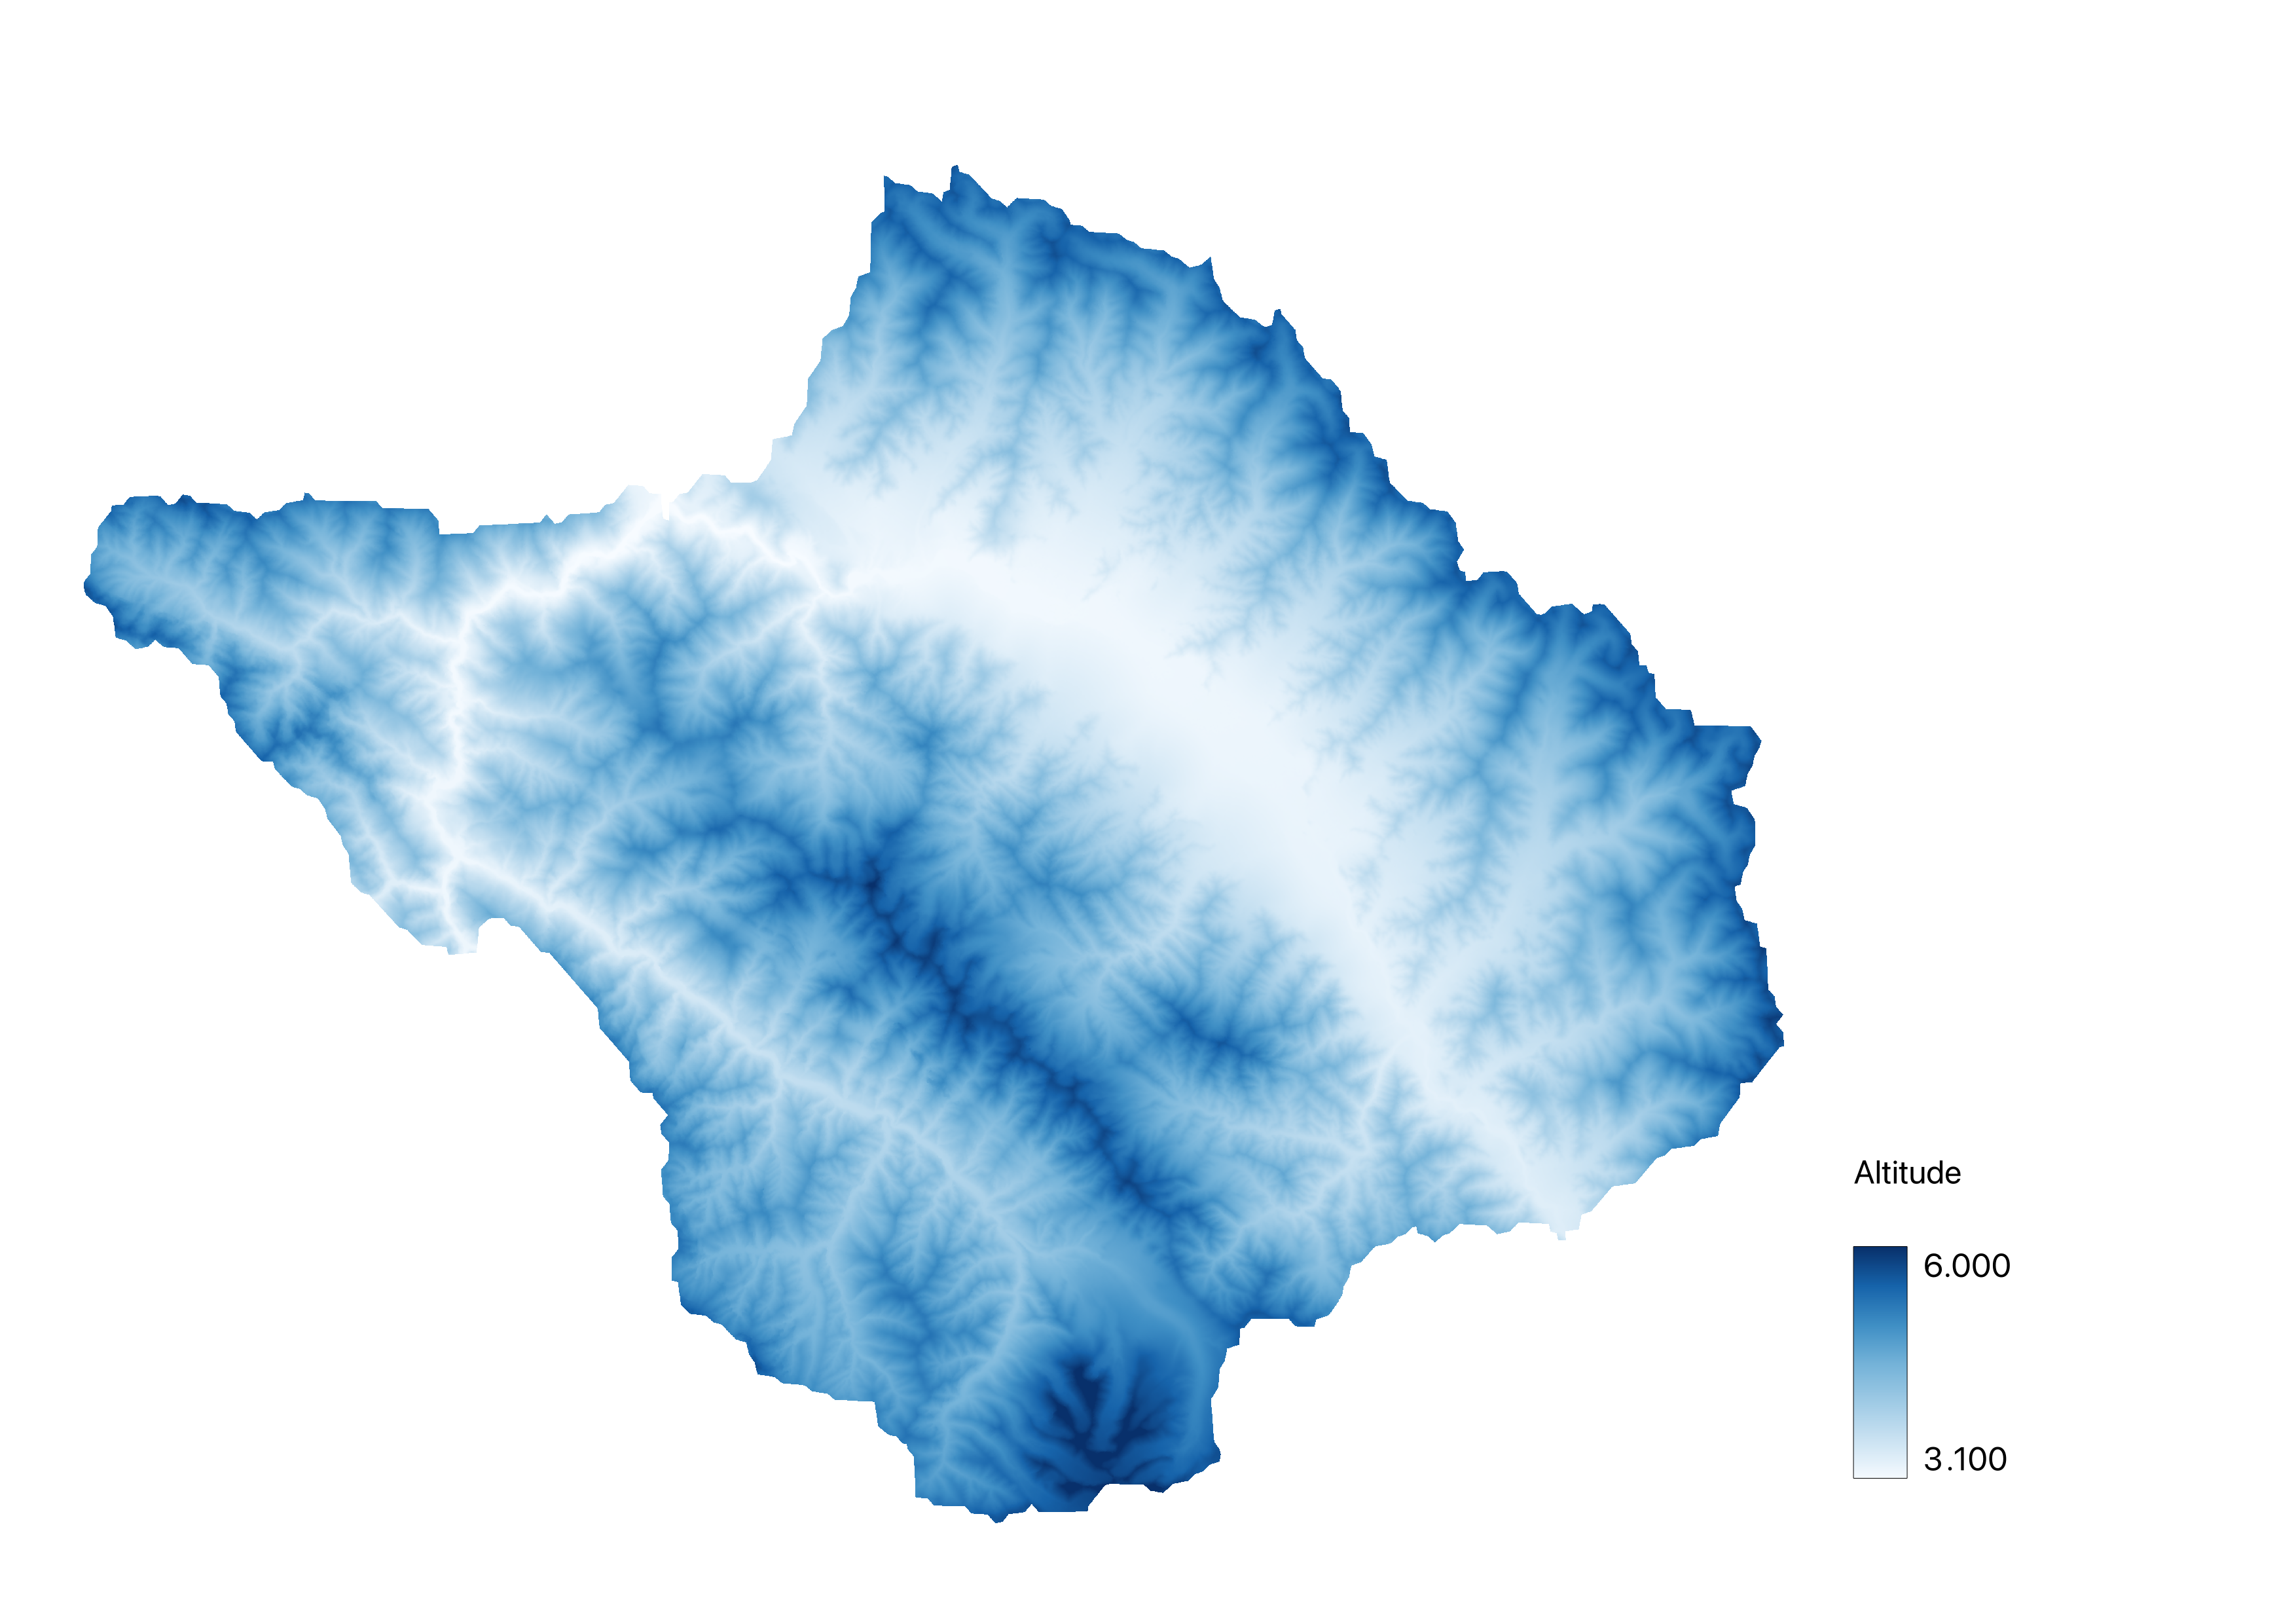
Fig. 164 Exemplary Digital Elevation Model of an area in the Indian Himalayas#
Discontinous rasters contain catigorical data, where each pixel represents a discrete classvalue rather than a value on a continuous scale. The information in these types of raster is sometimes also suitable for the storage with vector data. Some examples of classified maps include:
Landcover/Land Use Maps with discrete classes
Tree height maps classified as short, medium, and tall trees
Risk maps with multiple distinct risk classes
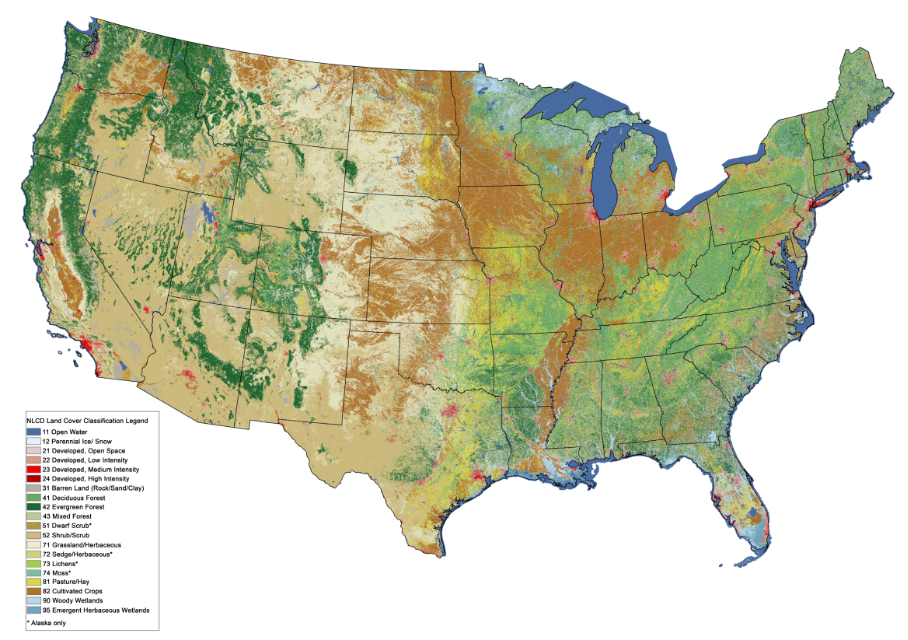
Fig. 165 Exemplary land cover classification raster of the USA#
Properties of Raster data#
Spatial Extent#
The spatial extent of a raster refers to the geographical area covered by the grid of cells in the raster dataset. It defines the boundaries of the raster dataset in terms of its geographical coordi-nates. The spatial extent is typically described by the minimum and maximum values of the spatial coordinates in every geographical direction (e.g. minimum and maximum latitude and longitude) that encompass all pixels of the raster.
BEISPIEL ABBILDUNG
Spatial Resolution#
The spatial resolution of a raster refers to the area represented by each individual pixel on the ground in the real world. It quantifies the level of detail of the spatial representation within the dataset. For example, a spatial resolution of 30 metres per pixel means that each pixel represents an area of 30x30 metres on the ground. High spatial resolution means smaller pixel sizes, resulting in finer detail and more accurate representation of spatial features within the dataset.
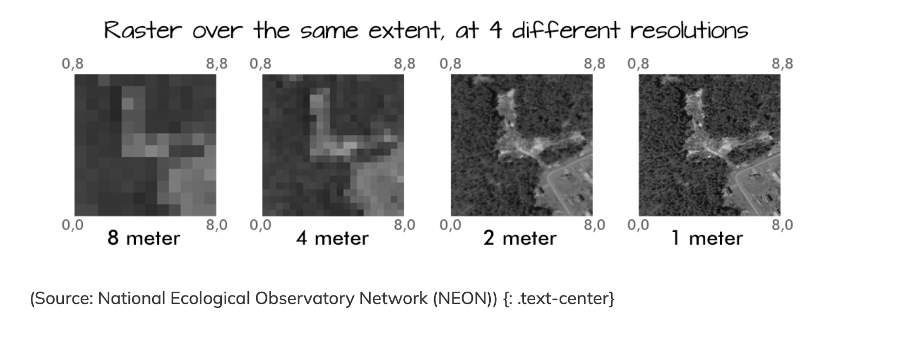
Fig. 166 Different spatial resolutions of the same raster#
Coordinate Refernce Sytem (CRS)#
As with vector data, the Coordinate Reference System (CRS) of a raster dataset refers to the spa-tial reference framework used to define the geographic location and orientation of the raster on the Earth’s surface (CRS WIKI link). It provides a standardised way of representing spatial coor-dinates and ensures that raster data can be accurately geolocated and integrated with other geo-spatial datasets.
The CRS includes a number of different parameters:
Coordinate system: This defines how spatial coordinates are represented. Common coordinate systems include geographic (latitude and longitude) and projected (e.g. Universal Transverse Mercator - UTM).
Datum: The datum specifies the reference ellipsoid and geodetic parameters used to model the shape of the Earth. It ensures consistency of spatial measurements across different datasets (e.g. the WGS 84 ellipsoid).
Unit: The unit of measurement for spatial coordinates, such as metres (e.g. in UTM) or degrees in the case of geographical coordinates.
Origin: The origin or reference point of the coordinate system, which may vary depending on the projection method used.
Metadata#
Metadata for raster data consists of descriptive information that provides context and details about the raster dataset. It includes information such as the dataset source, creation date, spatial extent, spatial resolution, coordinate reference system (CRS), data type, units, compression tech-niques, processing steps, accuracy ratings, and copyright/licensing information.
This metadata helps users to understand the content, origin, quality and appropriate use of raster data. It facilitates data discovery, evaluation and integration into geospatial workflows, ensuring that users can effectively interpret and use the data for their specific applications.

Fig. 167 Metadata of raster dataset of population counts (Worldpop)#
File Format#
There are multiple different file formats for storing an working with raster data. Following a short overview over the most common formats that you will likely come by as you work with spaptial rasters:
GeoTIFF (.tif/.tiff): Widely used file format, supports georeferencing and metadata.
GeoPackage (.gpkg): Open format for storing geospatial data, supports raster and vec-tor.
JPEG (.jpg/.jpeg) & PNG (.png): Common formats for images, lacks georeferencing.
Esri Grid (.adf): Esri’s raster format, used in ArcGIS, supports georeferncing amd metadata
GeoPackage (.gpkg): Open format for storing geospatial data, supports raster and vec-tor.
Frequently used Tools in QGIS#
Raster Calculator#
The raster calculator enables the performing of mathematical operations on one or multiple raster layers by using different expressions. These expressions can involve arithmetic operations like multiplication, comparison operators like “<” or “>”, conditional expressions like “IF” “THEN” statements, and mathematical functions like “mean” or “sum”.
Example: You have a Digital Elevation Model with the Altitude in m and a Landcover Classification raster. You want to produce a raster with all acricultural areas (raster value = 5) above 1500m.
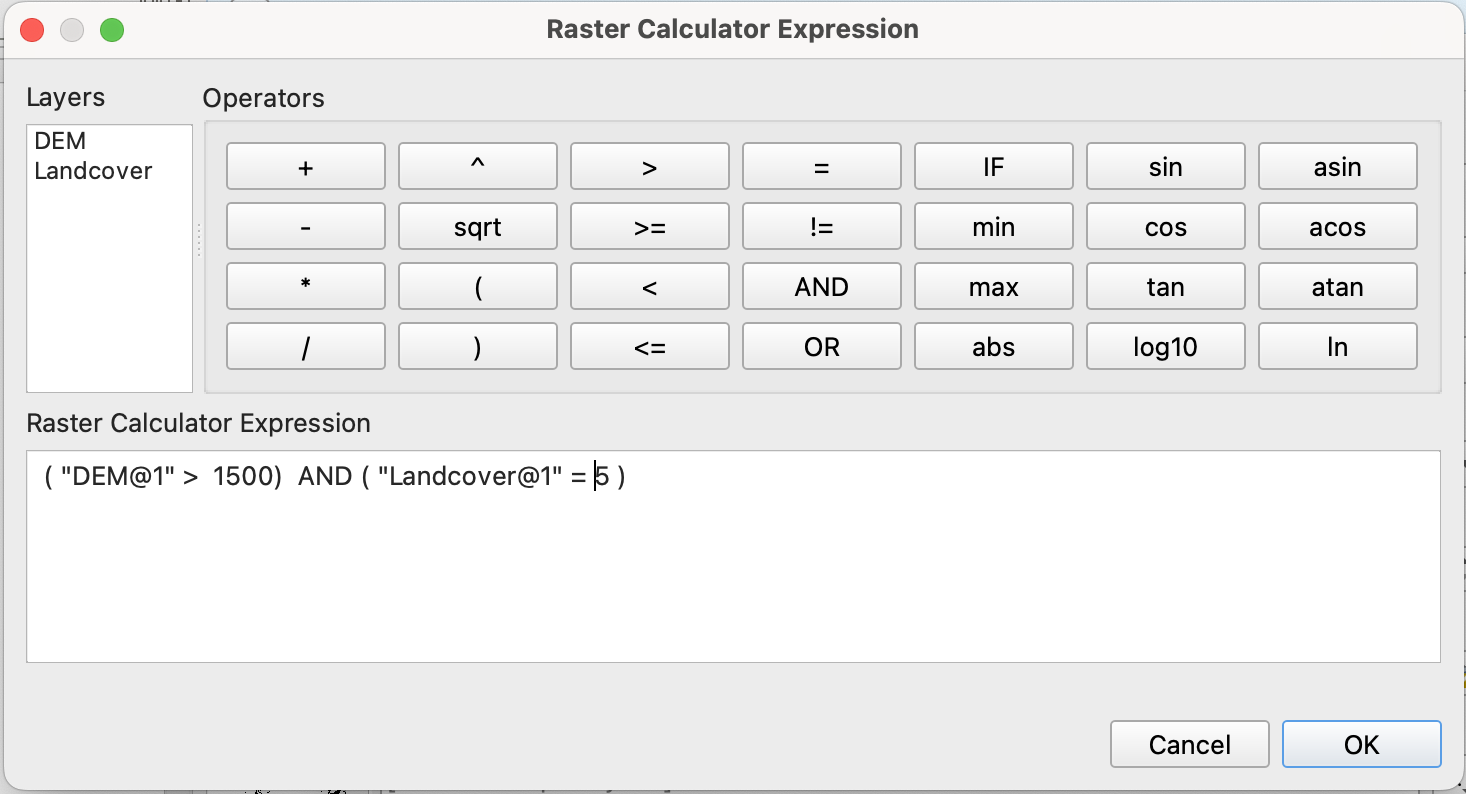
Fig. 168 Interface of the “Raster calculator” tool#
The wanted result can be achieved by firstly selecting both of the relevant rasters as inputs for the raster calculator and then using the expression interface to selct all pixels with a elevation above 1500m ( “( “DEM@1” > 1500)”) and a landcover value of “5” (”( “Landcover@1” = 5 ) “) by connecting both expression with the logical operator “AND”. In the calculated raster all pixels that fulfill the condition will have the value “1”, all other pixels the value “0”.
Zonal Statistics#
The Zonal Statistics tool calculates statistics (like mean, median, sum, etc.) for each zone (= polygon) in a specified zone layer based on the cell values of a raster layer. This is particularly useful for analyzing raster data within defined geographic zones, such as administrative boundaries or land use classes.
Example: We have a rasterlayer with population count affected by a recent flood in Pakistan and a polygon layer with administrative districts. We want to calaculate the number of flood affected people per district.
1. As "Input Layer" choose your polygon layer with district extents. "Pakistan_admin2" in this case.
3. As "Raster Layer" choose the layer with the cellvalues you want to base your statistics on. "Pop_floodextent" in this case.
4. Defining a prefix for your output column is optional but can be helpful for finding the calculated values in large attribute tables. For population counts you can for example choose "pop_" as "Output column prefix".
5. Below "Statistics to calculate" click on the  icon to access the different options of statistical operations available for calculating polygon values based on your raster. In this case "sum" would be the operation of choice as we want the total sum of floodafeccted people per district.
:::{dropdown} Solution
:open:
"Sum" is the appropriate method, as we want the total population count per district that results from the additions of the values of all cells with affected population per district.
:::
6. Name your layer "Floodaffected_pop_admin2", save it to your "output" folder and click `Run`.
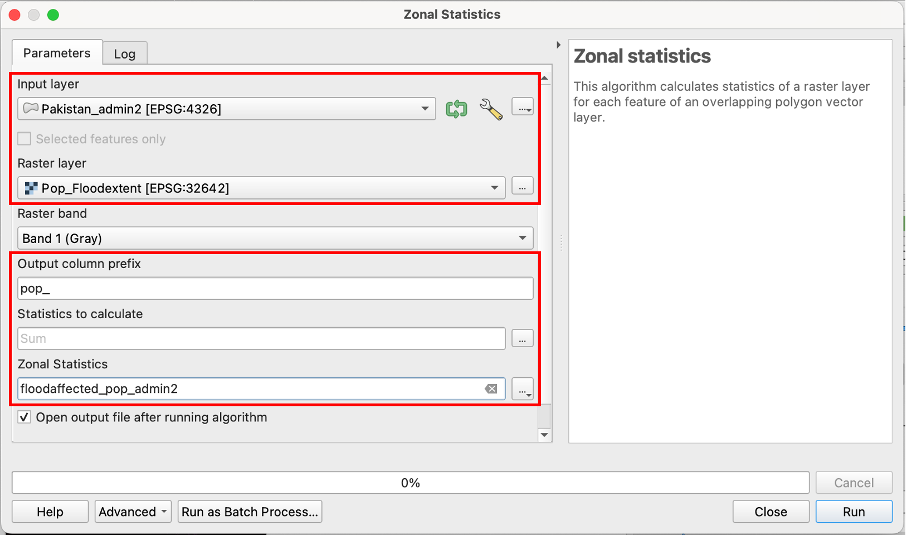
Fig. 169 Interface of the “Zonal statistics” tool#
Align rasters#
With the “Align rasters” tool raster with different spatial resolutions, grid orientation and CRS can be aligned to achieve a matching configuration of these attributes. This is particularly useful to preprocess rasters for for conducting precise spatial analysis, such as overlay operations, statistical analysis, raster calculator operations in general.
Example: We have a elevation and precipitation rasters with different spatial resolution and want to align the rasters for the analysis of precipitation sums in high altitude areas: 1. Click on the three dots next to the “Input layers” prompt and choose the rasters you want to align by checking the boxes next to them. 2. Choose the raster you want to use as blueprint for the alignment. In this cas we want to align both rasters to the parameters of the “Elevation” raster. 3. If you want to reproject the aligned rasters to a new CRS different from the Reference layers you can choose it under “Override reference CRS”.
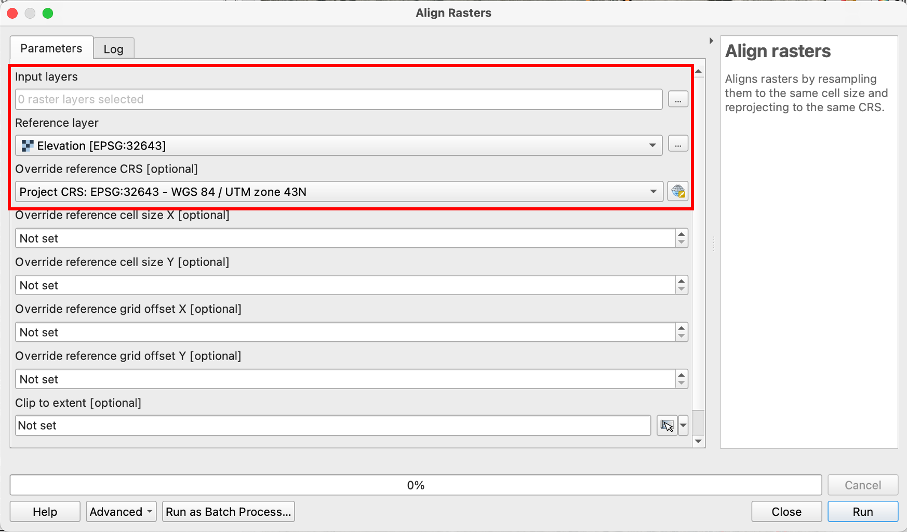
Fig. 170 Interface of the “Align Rasters” tool#
Note
There are further optional operations that allow you to set a specific cell size (in x and y direction) and grid offset different from the reference raster or clip the output to a defined extent. This can be handy for very specific use cases, but is not necesssary in the majority of applications.
Use and Sources of Raster Data in the Humanitarian Sector#
In the humanitarian sector, many different types of raster data are used in various application areas. The most important grid types include population grids, which can form the basis for calculating the exposure of the population to a natural hazard like floods, or precipitation grids, which can significantly help to understand droughts.
If raster data is available at several points in time or even as a continuous data series, parameters such as the condition of agricultural land can be measured with data like a series of rasters of a vegetation index.
Main products/raster types you may come across in the humanitarian sector include:
Population Rasters offered by Worldpop
Digital Elevation Models like the SRTM DEM
Landuse and Lancover Classifications
Risk Maps like flood inundation zones alongside rivers
Popular and proven sources for raster data include:
HDX (The Humanitarian Data Exchange) Data Portal:
#
Offering: Hosts a wide range of humanitarian data for a variety of countries, including raster data regarding population countts/density and demographic parameters like age and sex structurs or birthrates.
Pros and Cons
No account needed
Intuitive Interface with good filter options
Most of the data openly accessible and free
Many different data formats and sources, sometimes a unstructured
You can acces the HDX data portal (here).
USGS Earth Explorer#
Offering:The Data Portal of the US Geological Survey provides access to a vast collection of satellite imagery and derived products like DEMs and Landcover Data.
Pros and Cons:
Quite extensive archive of remote sensing data
Advanced search and filtering options
Acount is needed for data download
Data search needs basic knowledge of geospatial data and remote sensing
You can acces the USGS Earth Explorer (here).
ESA Earth Online#
Similar to the USGS earth explorer the data portal of the European space agency (ESA) provides access to Earth observation data from various sattelites and derived datasets like climate change indicators or disaster monitoring products.
Pros and Cons:
Wide range of basic and processed remote sensing products
Nice interface for visalization and basic analysis
Account is needed for data download
Data search needs basic knowledge of geospatial data and remote sensing
You can acces the earth online portal (here).