OpenStreetMap (OSM) Data #
Geofabrik #
The Geofabrik website offers downloads for OSM data by regions. You can select a region of interest and download all the OSM data inside of that region. This is the most extensive method. We recommend using this method if you want to explore the OSM data or you need a lot of OSM data. However, if you only need specific data, such as roads, or settlement points, or buildings, it might be better to choose the HOT export tool or QuickOSM.
Example
Go to __https://download.geofabrik.de/__ and navigate to the Mauritius
dataset by clicking onAfrica→MauritiusUnder Commonly Used Formats select the option
mauritius-latest-free.shp.zipand download the file. Place it somewhere on your computer where you can find it again and unzip it.Check out the content of the folder. There are many different shapefiles, each containing one kind of OSM data. The whole list of layers and what they include can be found here.
Open a new QGIS project and save it in the
projectfolder of your exercise folder.Load the file
gis_osm_places_a_free_1.shp. This polygon layer contains the boundaries of different features. Take some time to explore the data by using the attribute table.(Optional) You can select all features within the layer with the “fclass” = “island” and export them as a new layer. This will allow you to start creating a map of the islands of Mauritius.
Load the file
gis_osm_buildings_a_free_1.shp. This polygon layer contains all buildings in Mauritius mapped on OSM. Take some time to explore the layer.Add a satellite base map by using the QuickMapServices plugin to check if there are unmapped buildings.
Load the file
gis_osm_landuse_a_free_1.shp. Check out the dataset and use the classification function to get a better overview.Right-click on the layer
gis_osm_landuse_a_free_1in theLayer Panel->Properties. A new window will open up with a vertical tab section on the left. Navigate to theSymbologytab.On the top you find a dropdown menu. Open it and choose
Categorized. UnderValueselect “fclass” (short for featureclass).Further down the window click on
Classify. You will see all unique values of the “fclass” column. You can adjust the colours by double-clicking on one row in the central field. Once you are done, clickApplyandOKto close the symbology window.
As you can see, Geofabrik is great if you want to get complete OSM datasets for whole countries or regions.
QuickOSM #
The QuickOSM plugin allows you to load OSM data from inside your QGIS window. It is a quick and easy method, but requires the deepest knowledge about the OSM data model compared to the other options.
You will need to formulate a data query to find the data that you are looking for. To tailor your query based on the exact key and value you need there are two great resources:
OSM Wiki, and especially the Map features article.
This method has the advantage that you can specifically download the data that you need but you need to know how to formulate queries. To use QuickOSM, you have to install the QGIS plugin.
Overpass Turbo #
Overpass Turbo is a web-based data export tool for
OSM. By running a query, you can download the data and import it into your project.
You can either run it by writing your query on the left or by using the wizard
which will assist you in writing your queries.
Example
To search for schools in your bounding box or search area you can either write
the query yourself or get it built by the wizard.
1. Check Tagging Guidelines
Search for it in the OSM wiki and/or
taginfo. In our example it is: amenity=school
2. Write or build the query
Either use the wizard by typing in amenity=school in Heidelberg or write your
own query (f. e. for your bounding box):
Wizard:
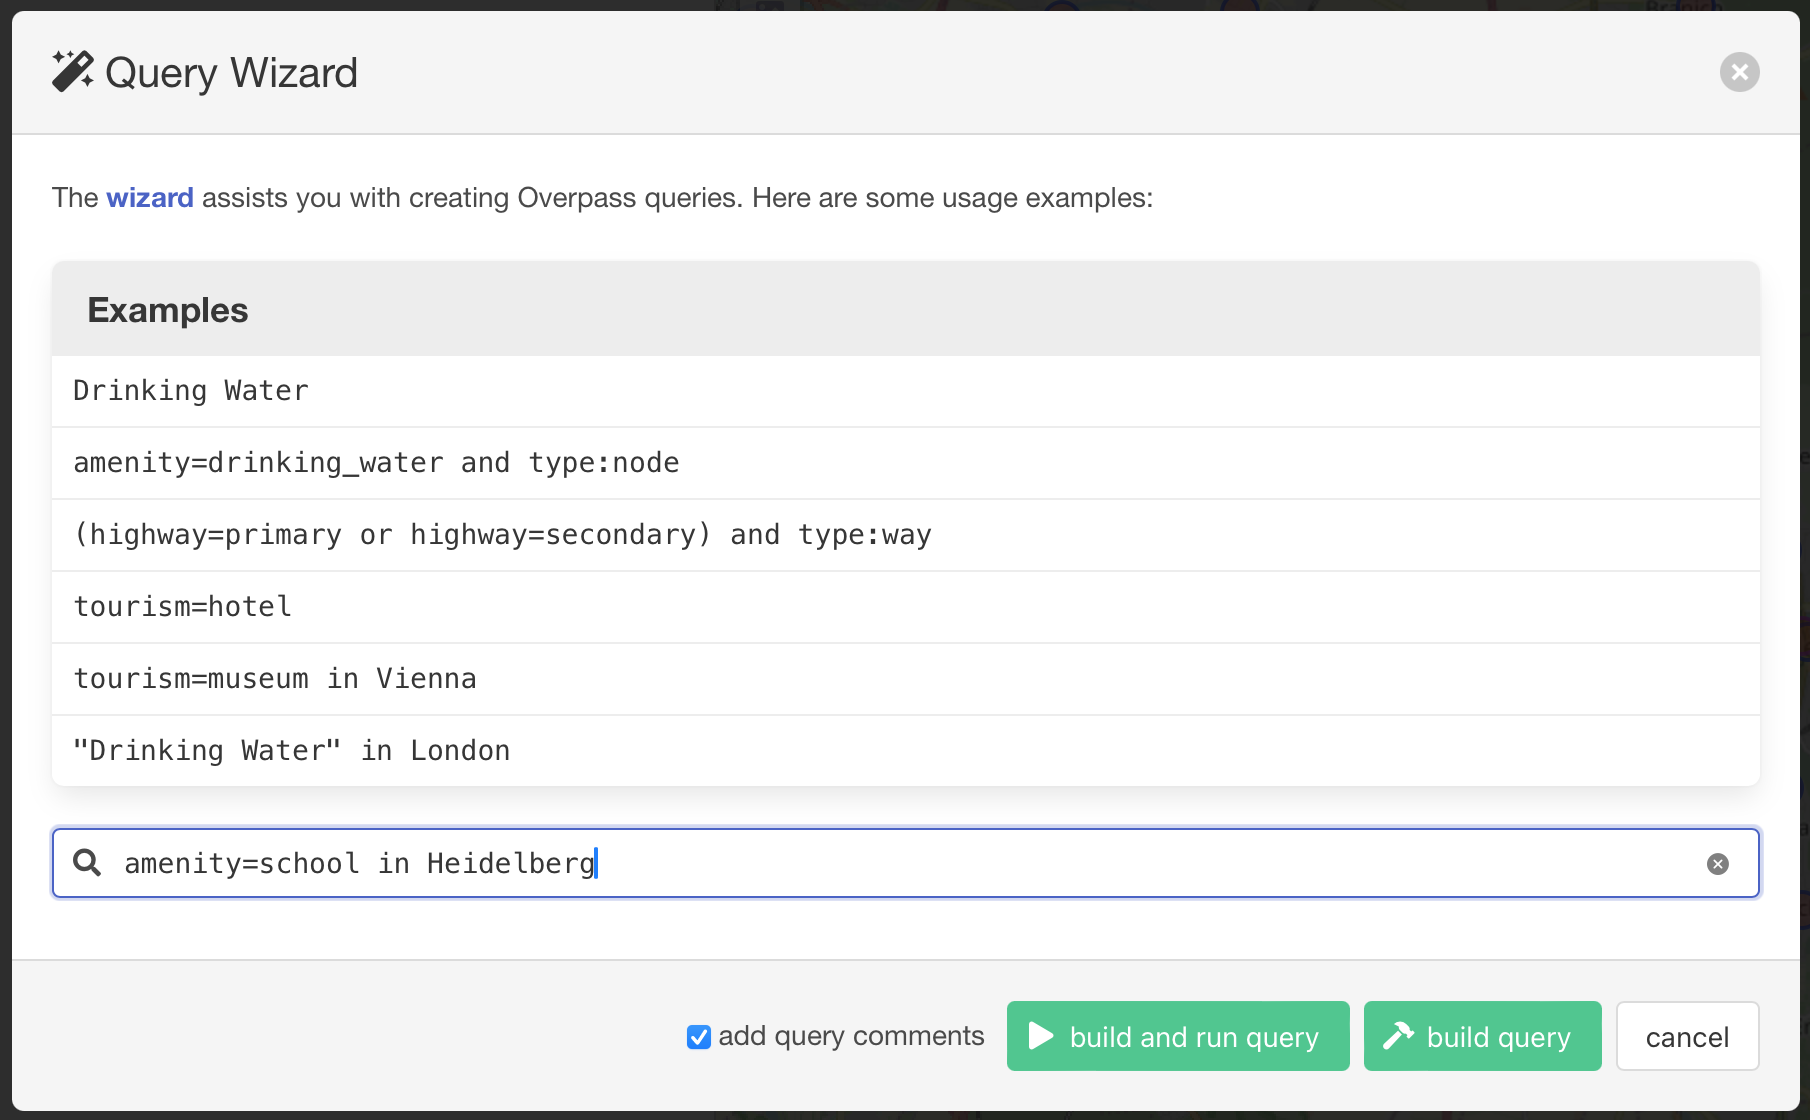
Fig. 7 Screenshot of the Wizard in overpass turbo.#
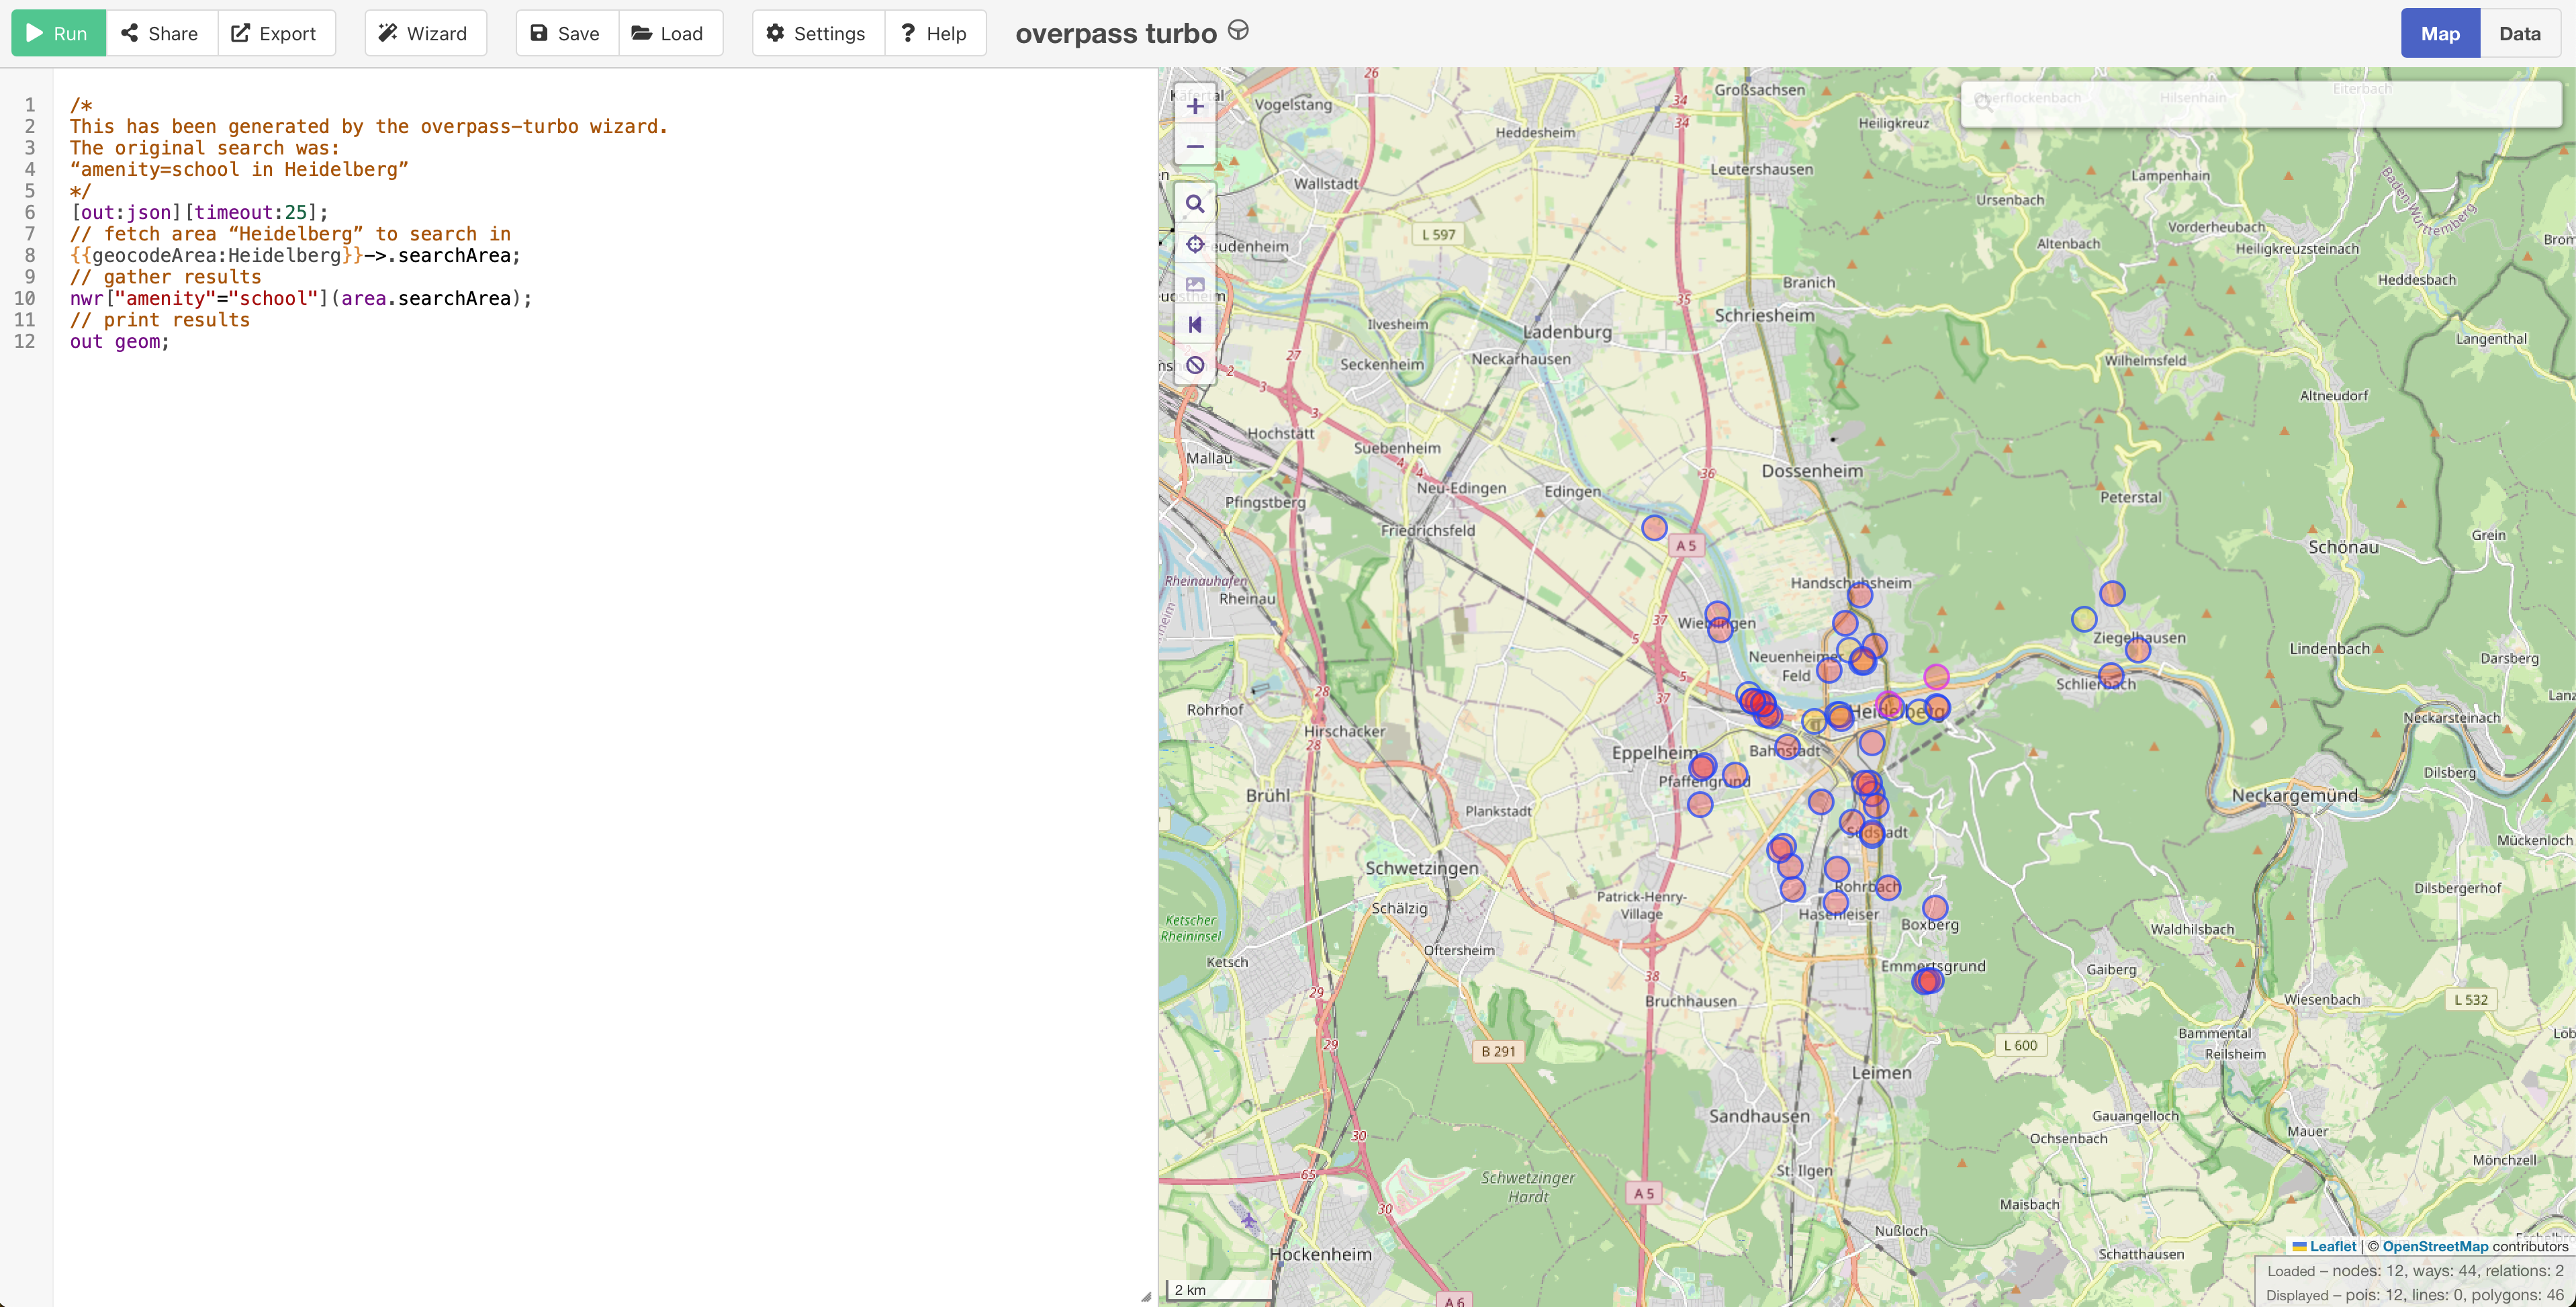
Fig. 8 Screenshot of the result#
Query:
[out:json];
(
  node ["amenity"="school"](49.35,8.553,49.481,8.756);
  way ["amenity"="school"](49.35,8.553,49.481,8.756);
  relation ["amenity"="school"](49.35,8.553,49.481,8.756);
);
out;
Bounding Box
To query with a bounding box you need a special format. Specify it like so:
s (southern limit in decimal degrees, lowest latitude)
w (western limit in decimal degrees, lowest longitude)
n (northern limit in decimal degrees, highest latitude)
e (eastern limit in decimal degrees, highest longitude)
for example:
node ["key"="value"] (s, w, n, e);
         out;
Tip
For more information on the query language check out the Language Guide.
3. Download the data
One can export the results in various ways.
By exporting the data as f.e. GeoJSON you can later on import them in your QGIS project.
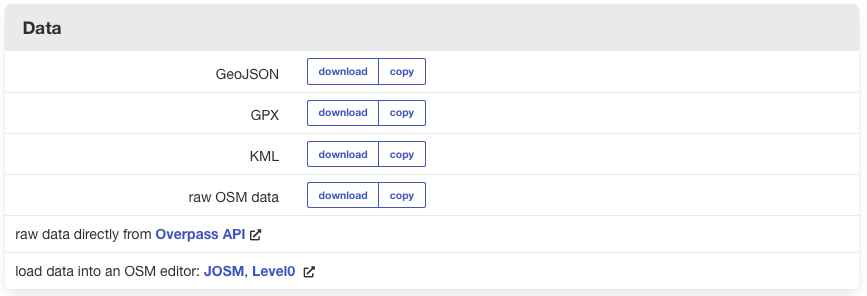
Fig. 9 Screenshot of how to export data in overpassturbo.#
By exporting the query as map, you can share your current view as link or image.
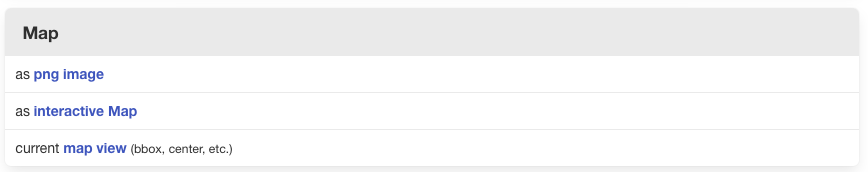
Fig. 10 Screenshot of how to export map in overpassturbo.#
By exporting your query you can get the text or convert it to an OverpassXML or OverpassQL formatted query.
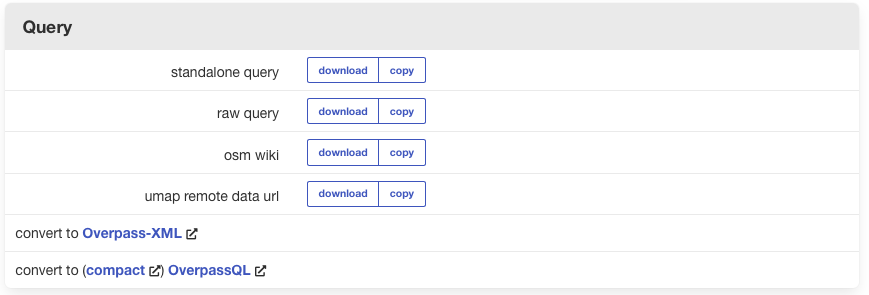
Fig. 11 Screenshot of how to export query in overpassturbo.#
Tip
For more information, check out the wiki.