Network centrality measures and its application in QGIS#
In chapter Spatial Network Analysis Theory we introduced the concept of spatial networks for the application of routing and accessibility. This chapter aims at extending our understanding of networks encompassing metrics to describe their shape, function and general properties.
This chapter provides an overview on the following questions:
What are common network metrics
Degree centrality
Betweenness centrality
Closeness Centrality
Eigenvector Centrality
PageRank
Clustering Coefficient
However we focus on betweenness and closeness centrality
Betweenness#
Betweenness centrality is a measure that quantifies the importance or influence of a node within a network by assessing the extent to which the node lies on the shortest paths between other pairs of nodes. In other words, it captures how frequently a node acts as a bridge or intermediary in connecting different parts of the network.
Graph representation: nodes & edges
Directed and weighed graph
Betweenness centrality: Rank nodes/edges by their importance/influence for overall connectivity within the network (eg bridges, bridgeheads)
Limitations of standard betweenness centrality and modification#
The following describes betweeness centrality in a standard and modified way exemplary.

Fig. 215 Standard betweenness centrality from every node to every other node.#
Shortest path between all nodes
Betweenness centrality score represents the amount of visits at every node/edge
The more visits, the more central is a node/edge
Limitation for specific analysis:
How important is a single road segment for commuting
How important is a single road segment for access towards healthcare
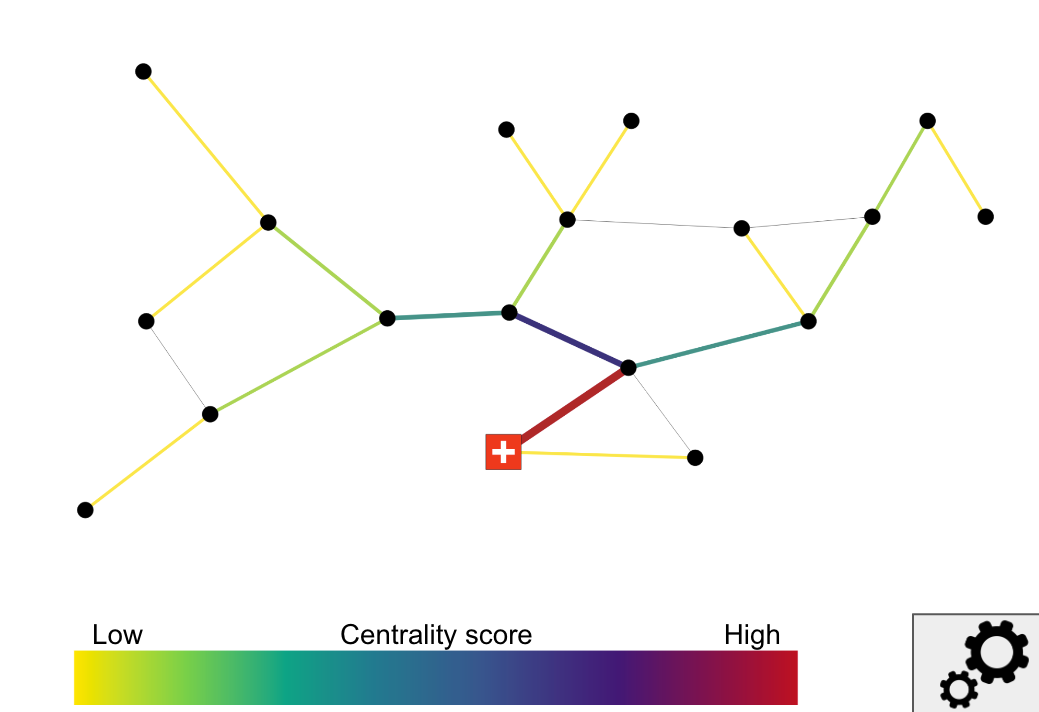
Fig. 216 Modified betweenness centrality every node towards one (subset) of nodes. In this example all nodes of the network are routed towards the node with the healthcare facility. The result shows higher centrality values at edges that create choke points toward the healthcare facility or are directly next to it.#
Modification: shortest paths between all nodes and subset
Departure: all nodes
Destination: hospital
Limitation: Biased towards roadnetwork density.

Fig. 217 Modified betweenness centrality. Simliar to above but only nodes are considered where data indicates population is located nearby.#
Further modification: shortest paths between subset and subset
Departure: population centers
Destination: hospital

Fig. 218 Modified betweenness centrality. Simliar to above but every route from a population center is weighted by the population count of the center.#
Possibility to include population counts as weights
Population density is not uniform
Demographics
Application for identifying critical infrastructure#
Research and paper publication conducted in 2021 on the influence of Cyclone Idai in Mozambique on the road network and access to healthcare facilities.
Utilized targeted betweenness centrality to assess changes in centrality scores of road segments.
Considered flooded areas as impassable and examined the impact on centrality.
Used population centers as origins and healthcare facilities as destinations for centrality measurement.
Identified roads that became more important for transportation towards healthcare services.
Demonstrated the crucial role of these roads in facilitating access to healthcare during natural disasters.
Highlighted the significance of targeted betweenness centrality in analyzing such scenarios.

Fig. 219 Comparision of road network centrality for non flooded (left) and flooded (center) scenario during cyclone Idai in Mozambique. The area shown covers the coastal city of Beira in the lower left loacted at the mouth of Pungwe river. The difference in betweenness centrality scores (right) hints at which roads became less and which became more important for reaching healthcare facilities.#
References#
Petricola, S., Reinmuth, M., Lautenbach, S. et al. Assessing road criticality and loss of healthcare accessibility during floods: the case of Cyclone Idai, Mozambique 2019. Int J Health Geogr 21, 14 (2022). https://doi.org/10.1186/s12942-022-00315-2
Zia M, Fürle J, Ludwig C, Lautenbach S, Gumbrich S, Zipf A. SocialMedia2Traffic: Derivation of Traffic Information from Social Media Data. ISPRS International Journal of Geo-Information. 2022; 11(9):482. https://doi.org/10.3390/ijgi11090482
Klipper, I. G., Zipf, A., and Lautenbach, S.: Flood Impact Assessment on Road Network and Healthcare Access at the example of Jakarta, Indonesia, AGILE GIScience Ser., 2, 4, , 2021. https://doi.org/10.5194/agile-giss-2-4-2021
Closeness#
Closeness centrality is a measure that quantifies how easily a node in a network can reach other nodes, based on the inverse of the average shortest path distance from that node to all other nodes in the network.
Determine the centrality of locations within a network based on efficient distance and time calculations for travel between different grid cell centroids in Rio.
Grid-based analysis: Employed a 200m grid overlay on the city to divide the wider area into manageable units for analyzing mobility patterns and exposure
Motorized and pedestrian routing profiles: Calculated travel distance and time for each grid cell centroid, considering both motorized travel and pedestrian routing options.
Purpose: Developed an exposure layer to understand human mobility patterns, particularly relevant for assessing the spread of vector-borne diseases like Dengue fever in Rio.
The analysis contributes to an exposure analysis by identifying individuals who may act as carriers of the disease, potentially getting bitten by a mosquito and infecting them, thereby aiding in disease prevention and control strategies.
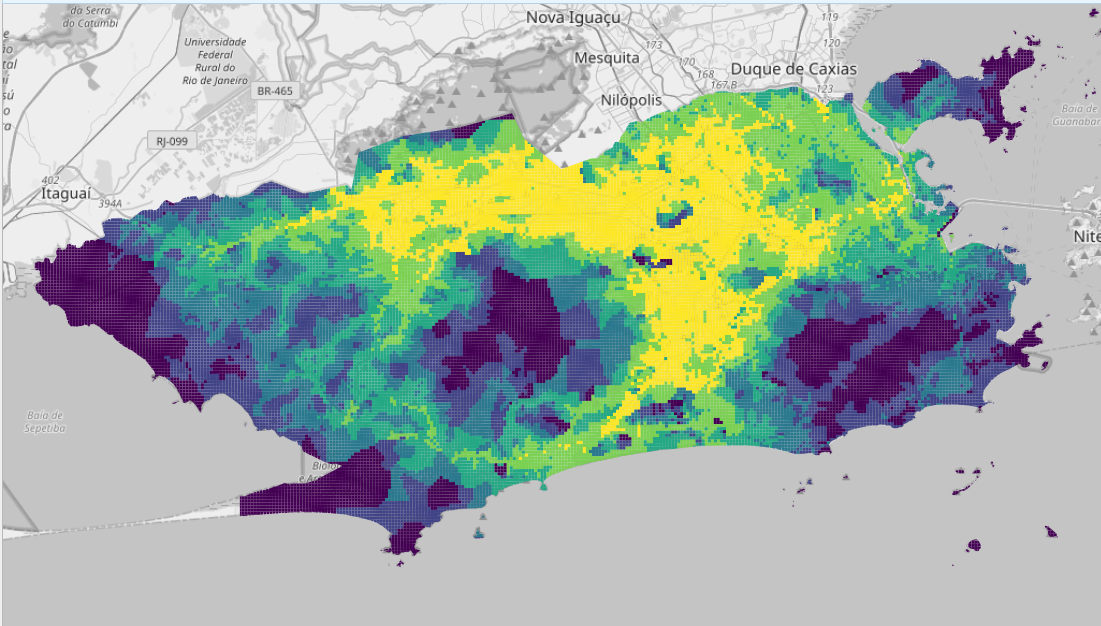
Fig. 220 Closeness centrality analysis for Rio de Janeiro. Represented in a grid, every cell is 500 x 500m wide. The color ramp from dark violet over blue, green and yellow represents closeness values from low to high. Cells with high closeness centrlaity indicate areas from which one can faster reach every other cell in the network, and therefore is considered closer.#