Automation theory#
Attention
🚧This part of the training platform is under ⚠️construction⚠️ and is not ready to be used in a training
Introduction into the QGIS Graphical Modeler#
The 
Graphical Modeler also known as the Model Builder allows users to create complex models using a simple and intuitive interface. Most analysis tasks in a GIS are not isolated, but part of a chain of operations resulting in a series of inputs and outputs (e.g. clipping the area of interest, performing a spatial join and applying some table functions). Using the Graphical Modeler, this chain of operations can be combined into a single process, which can then be easily re-run with a different set of inputs. Regardless of how many steps and different algorithms are involved in the analysis, a model is executed as a single algorithm, saving time and effort.
Graphical User Interface#
The Graphical Modeler can be accessed from the Processing menu Processing -> Graphical Modeler as shown in Fig. 181.

Fig. 181 How to open the Graphical Modeler in QGIS#
This will open the following window, which contains everything we need to build a model.
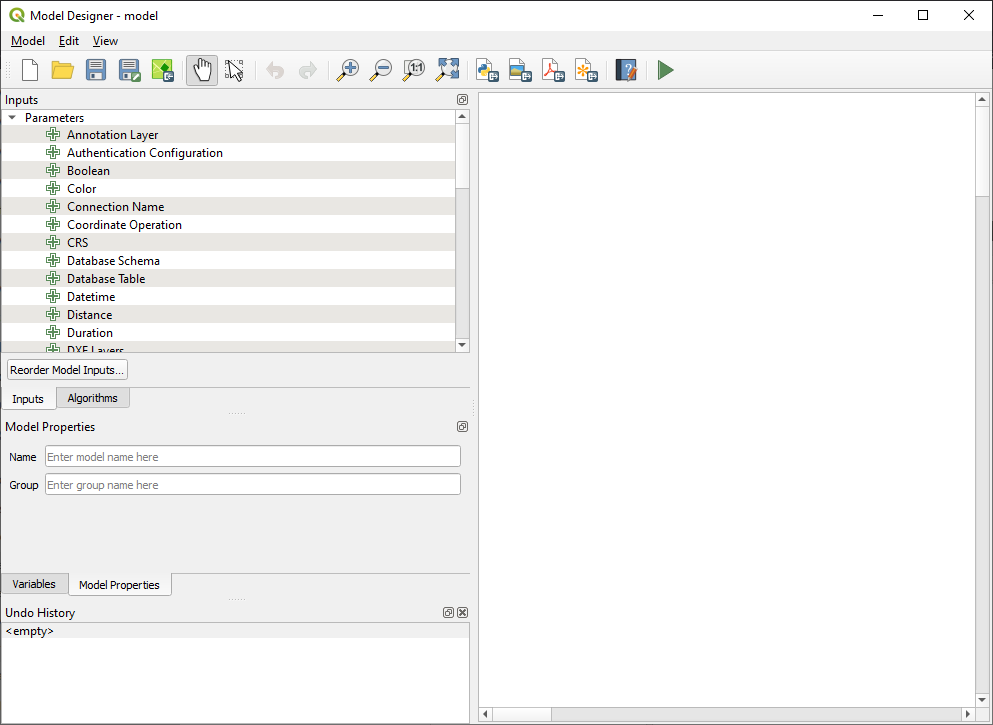
Fig. 182 Screenshot of the Graphical Modeler window for QGIS version 3.28.4#
In the Graphical Modeler window we can see several icons and menus. Firstly, we will focus on the left window for the Inputs and Algorithms section. Inputs are all the input variables or layers for a model, such as a Vector Layer, Raster Layer, String, Boolean, Expression and many others. The Algorithms are all the tools that are used to process the input variables. In the processing chain, one algorithm/tool will return an output that will be used by another/the following tool until the final output is created.
Creating a model#
Creating a model involves two basic steps:
Defining the necessary inputs. These inputs are added to the parameter window so the user can set their values when running the model.
Definition of the workflow. Using the input data of the model, the workflow is defined by adding algorithms and selecting how they use the defined inputs or the outputs generated by other algorithms in the model.
First exercise: Buffering of road infrastructure#
We will build our first simple model by buffering road segments. This process is based on a vector layer containing the road data and the buffer algorithm.
Selection of Inputs#
Select the Inputs tab from the left window and then select the Vector Layer by either double-clicking or dragging and dropping it onto the model canvas (Fig. 183). This will open the input Parameter Definition window (Fig. 184). In this window we can customize some vector input parameters such as Description (the name that the user will see when executing the model), Geometry type (Point, Line, Polygon) and can also define your input as mandatory for your model by ticking the Mandatory box. It is also possible to select the Advanced checkbox to set the input to be within the Advanced section. This is particularly useful when the model has many parameters and some of them are not trivial, but you still want to be able to select them.
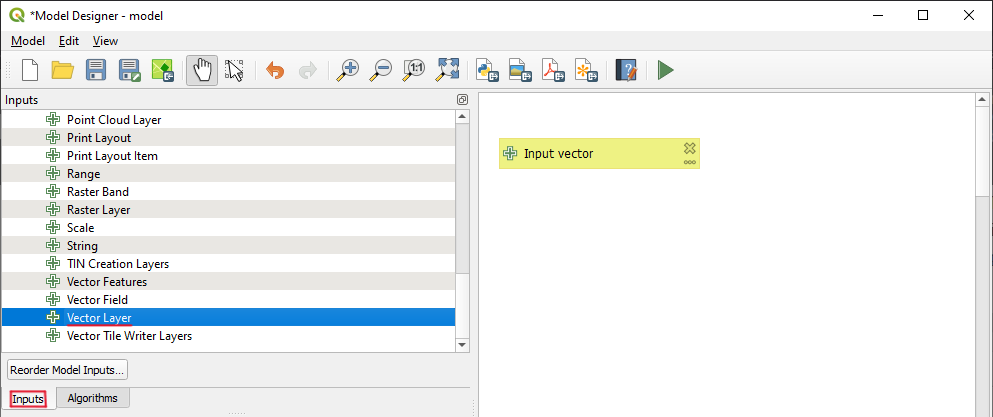
Fig. 183 Vector Layer as input#
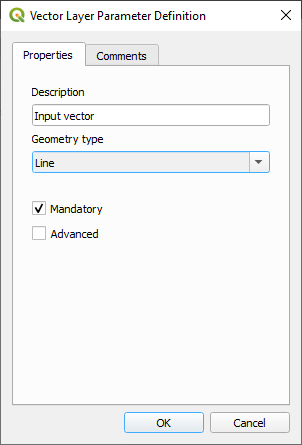
Fig. 184 Vector Layer Parameter Definition#
Selection of Algorithms#
Now select the Algorithms tab. There are many algorithms which are grouped together. If you know where an algorithm is, you can select it directly, otherwise search for it using the search toolbar. For this example we will search for the Buffer algorithm as shown in Fig. 185. Add it to the model canvas.
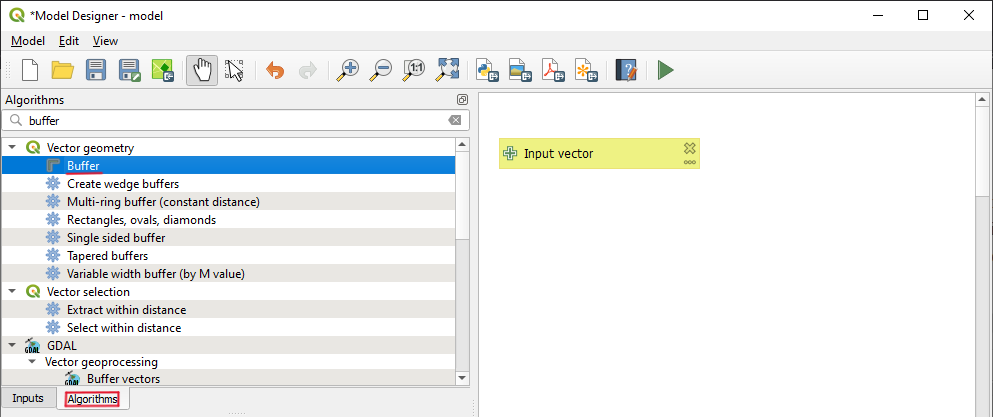
Fig. 185 Selection of Buffer algorithm#
When we double-click on it, the Buffer Algorithm window appears, as shown in the figure below.