Good Map Design & Semiological Errors#
In this chapter we will discuss well designed maps and give examples of how to recreate specific design elements in QGIS. A second part of this chapter will focus on common semiological missteps. If you need further examples for good map design, check out these websites/repositories:
Map Examples#
Map Example 1: Flood-affected areas and roads in the Somali Region, Ethiopia#
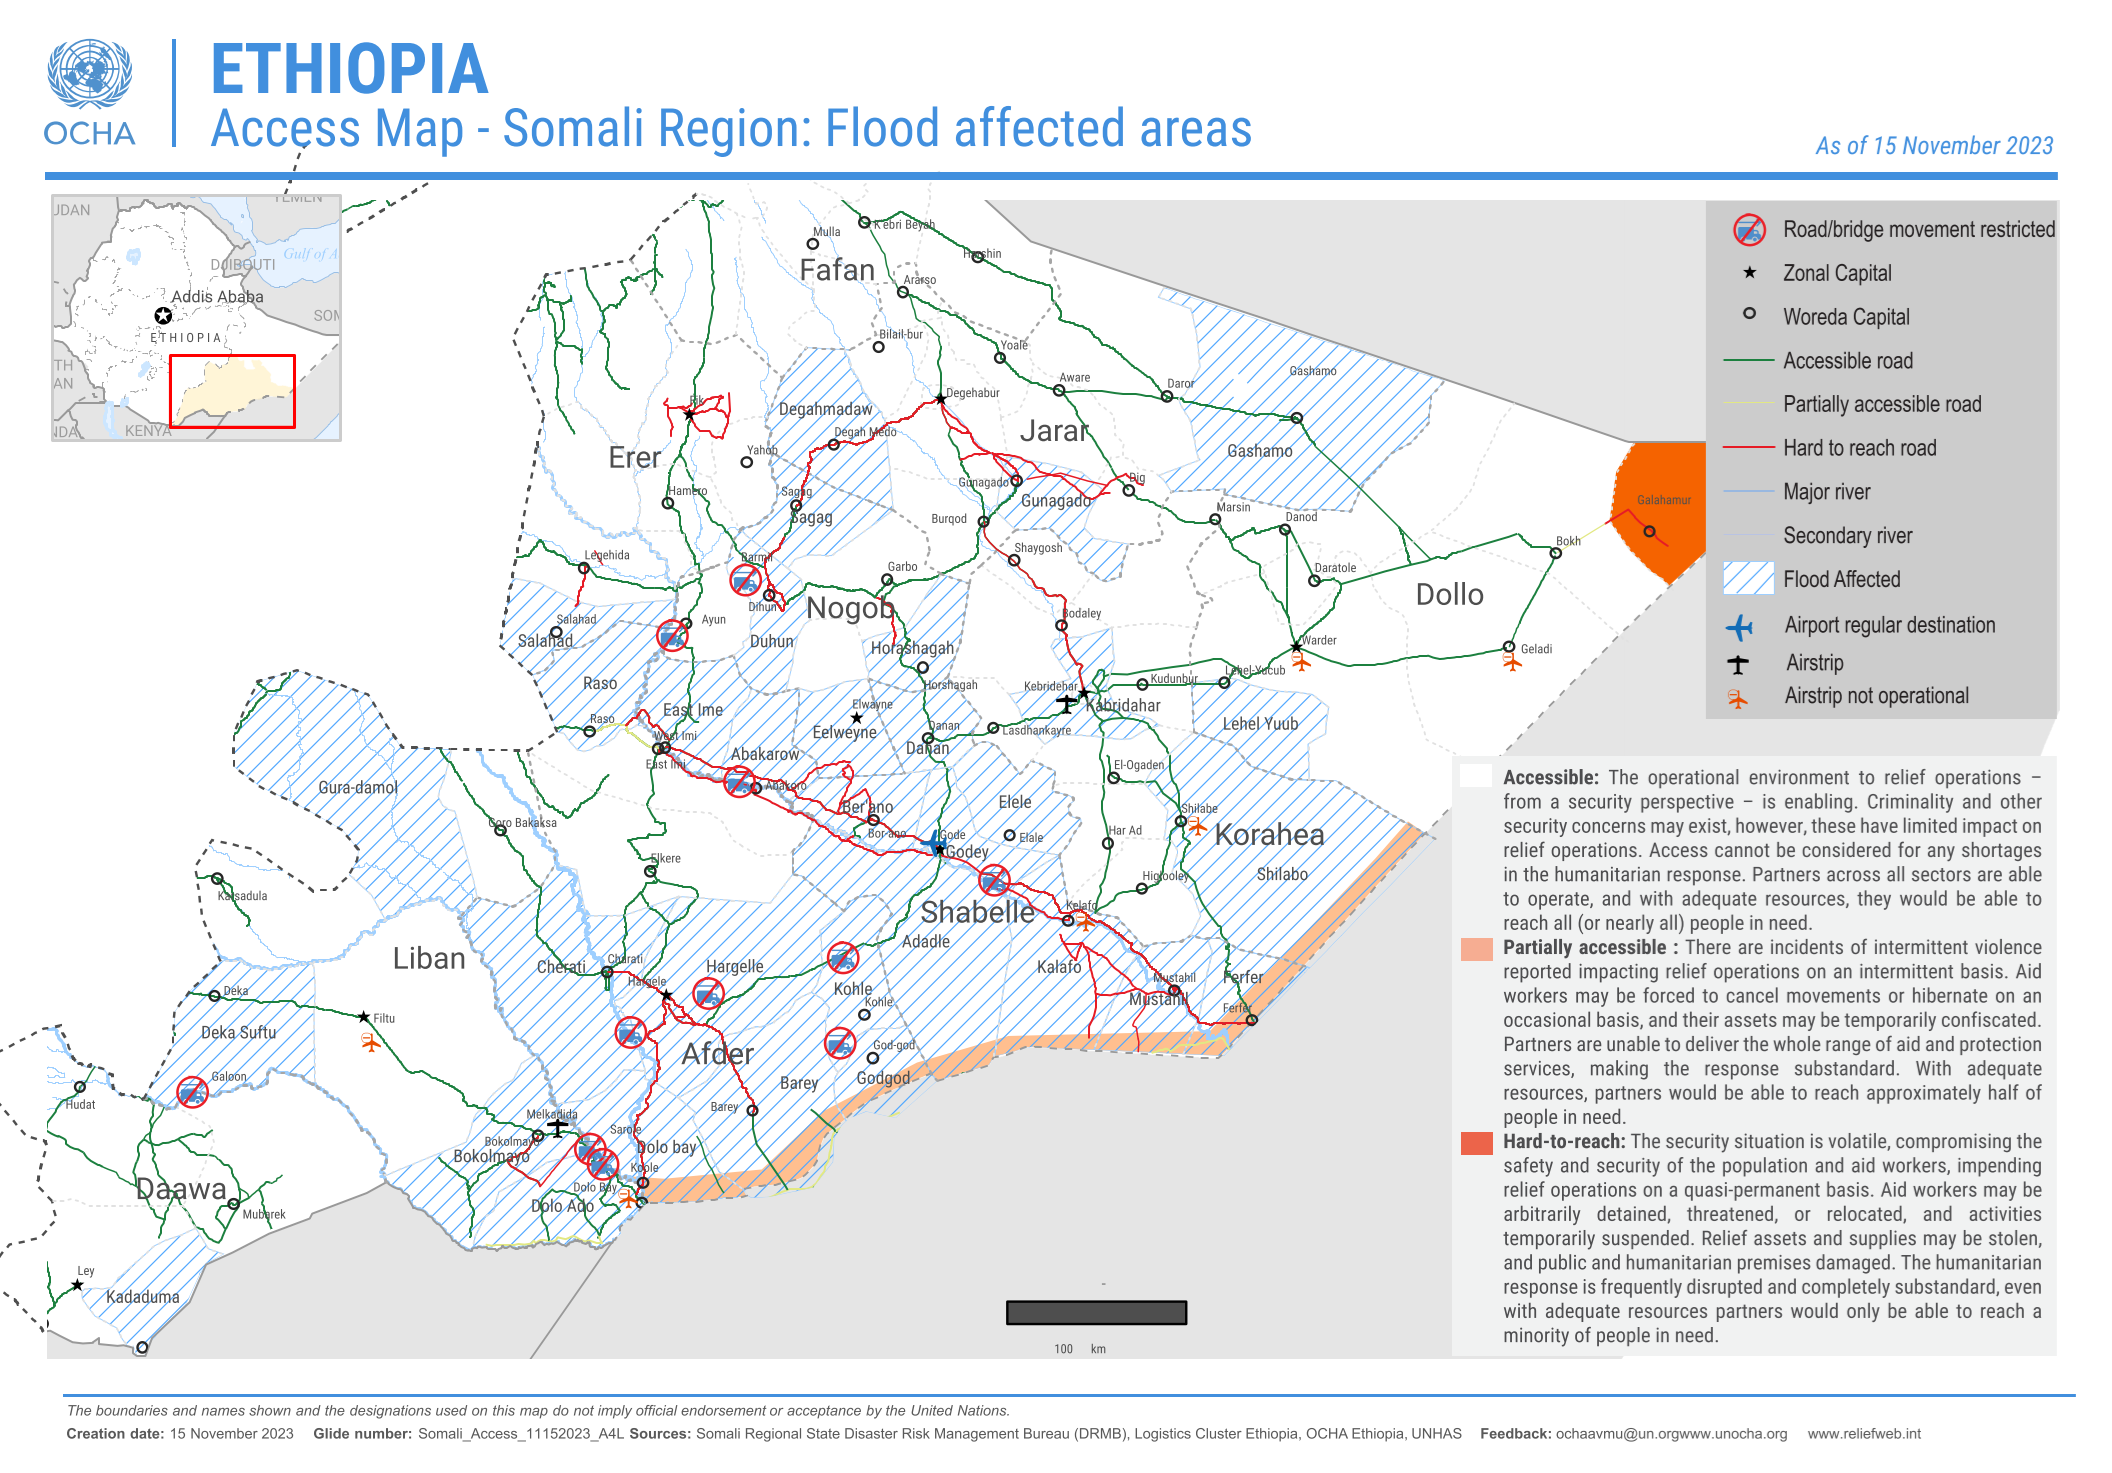
Fig. 134 Flood affected areas and roads in the Somali Region, Ethiopia (Source: OCHA)#
Context: Situation in Ethiopia
The Greater Horn of Africa receives 20 to 70 percent of the annual total rainfall in the months from October to December. The IFRC reports a exceptionally high forecast probability (over 80%) of experiencing wetter than normal rainfall condition. Additionally, El Niño conditions started between July and August, which further accrued the possibility of high rainfall conditions in Ethiopia.
Since October, floods have affected at least 763,000 people in the region, taken 33 lives in the Somali Region alone, and killed 4,806 livestock. The flooding has also resulted in immense damage to infrastructure, transportation, and schooling. The population’s livelihood and health have been greatly affected. The impact of flooding is projected to increase in the next years, which will lead to more flash and river floods.
Access maps, such as the one above, play a crucial role in helping informing information manager and ground staff which areas are accessible. This is especially important as a timely deployment of relief or aid operations is essential in flooding disasters.
(Source: IFRC)
The map above shows the flood-affected areas, as well as the important road networks in the Somali Region, Ethiopia in November 2023. Maps such as these are crucial for humanitarian aid workers when planning relief or aid operations and need to be up-to-date. They display important settlements and, most importantly, the accessibility of roads and airstrips.
This is a thematic map with a clear purpose, featuring only the most essential elements relevant to that purpose.
A shapefile for the flood affected areas was given a hashed fill. In QGIS, you can find this symbology.
A layer with the road network has been put above the layer with the flood-affected areas. The road symbology has been categorised into three categories: Accessible road (green), partially accessible road (grey), and hard-to-reach road (red).
The topmost layer is a point-layer with information on unaccessible roads or bridges as well as the location of airstrips and which airstrips are accessible. The points have been symbolized with SVG-symbols.
(The administrative boundaries of Ethiopia are set apart from the surrounding countries by making the polygon a clear white and the surrounding countries in a shade of grey. This can be achieved by copying the polygon of Ethiopia into a new layer, and changing the symbology respectively)
Note
The colour scheme of the roads makes it possible to read the map intuitively, as red is typically associated with negative qualities and green with positive qualities. It should be noted, however, that people with colourblindness will have trouble reading the map.
Map Example 2: Flooding Risk in the Ouham Region, Central African Republic#

Fig. 135 Flooding risk in the Ouham Region, Central African Republic (Source: REACH)#
Context: Situation in the Central African Republic
The Central African Republic has been hit by destructive floods in late 2019, which displaced over 100,000 people and caused considerable damage to infrastructure. The floods have destroyed shelters, obstructed transportation routes, and have led to disease outbreaks such as cholera and malaria. Due to climate change, such floods will become more frequent, leading to increased vulnerability for towns and villages. Since natural hazards are hard to predict, the changing climate reduces community resilience.
Source: REACH Initiative
This map displays the flooding risk using a raster image. The raster data was calculated using several factors, including the precipitation intensity, the maximum duration of precipitation, the height of the nearest drainage, the flow direction and river network, the topographic humidity, a digital elevation model, and the ground cover.
The raster data is displayed using a diverging colour ramp. (Here you can see how to assign a colour ramp)
The surrounding administrative districts have been overlayed with a transparent grey.
The river network has been added in blue.
The main roads as well have been added in black.
Settlements are displayed as black dots. This helps to identify areas with a higher population density in the areas most at risk.
Common Missteps in Semiology#
1. The Modifiable Areal Unit Problem#
Caution
Be careful when representing data in administrative regions.
The Modifiable Areal Unit Problem (MAUP) is a statistical bias that arises when spatial data is aggregated into regions. It highlights how the results of spatial analysis can change depending on how data is grouped into areal units (spatial zones).
The Modifiable Areal Unit Problem has two key components:
Scale Effect:
The scale of aggregation (small vs. large areas) affects the results.
When smaller units (e.g., census blocks) are used, the analysis may capture fine-grained local variations.
When larger units (e.g., counties or states) are used, local variations get smoothed out, and the results may show broader trends. For example, average income might vary significantly at the neighborhood level but look more uniform at the county level.
Zoning Effect:
The shape and arrangement of the zones used for aggregation can also affect the results.
Changing the boundaries of zones (e.g., splitting a city into east-west vs. north-south regions) can lead to different outcomes, even if the total population or data remains the same. This happens because boundaries influence how values are averaged or summed.
Why is this important in GIS?
Policy Decisions: If the analysis depends on arbitrary boundaries, decisions (e.g., allocating resources) might be based on misleading results.
Spatial Statistics: Correlations, regressions, and other analyses involving spatial data can be biased due to MAUP.
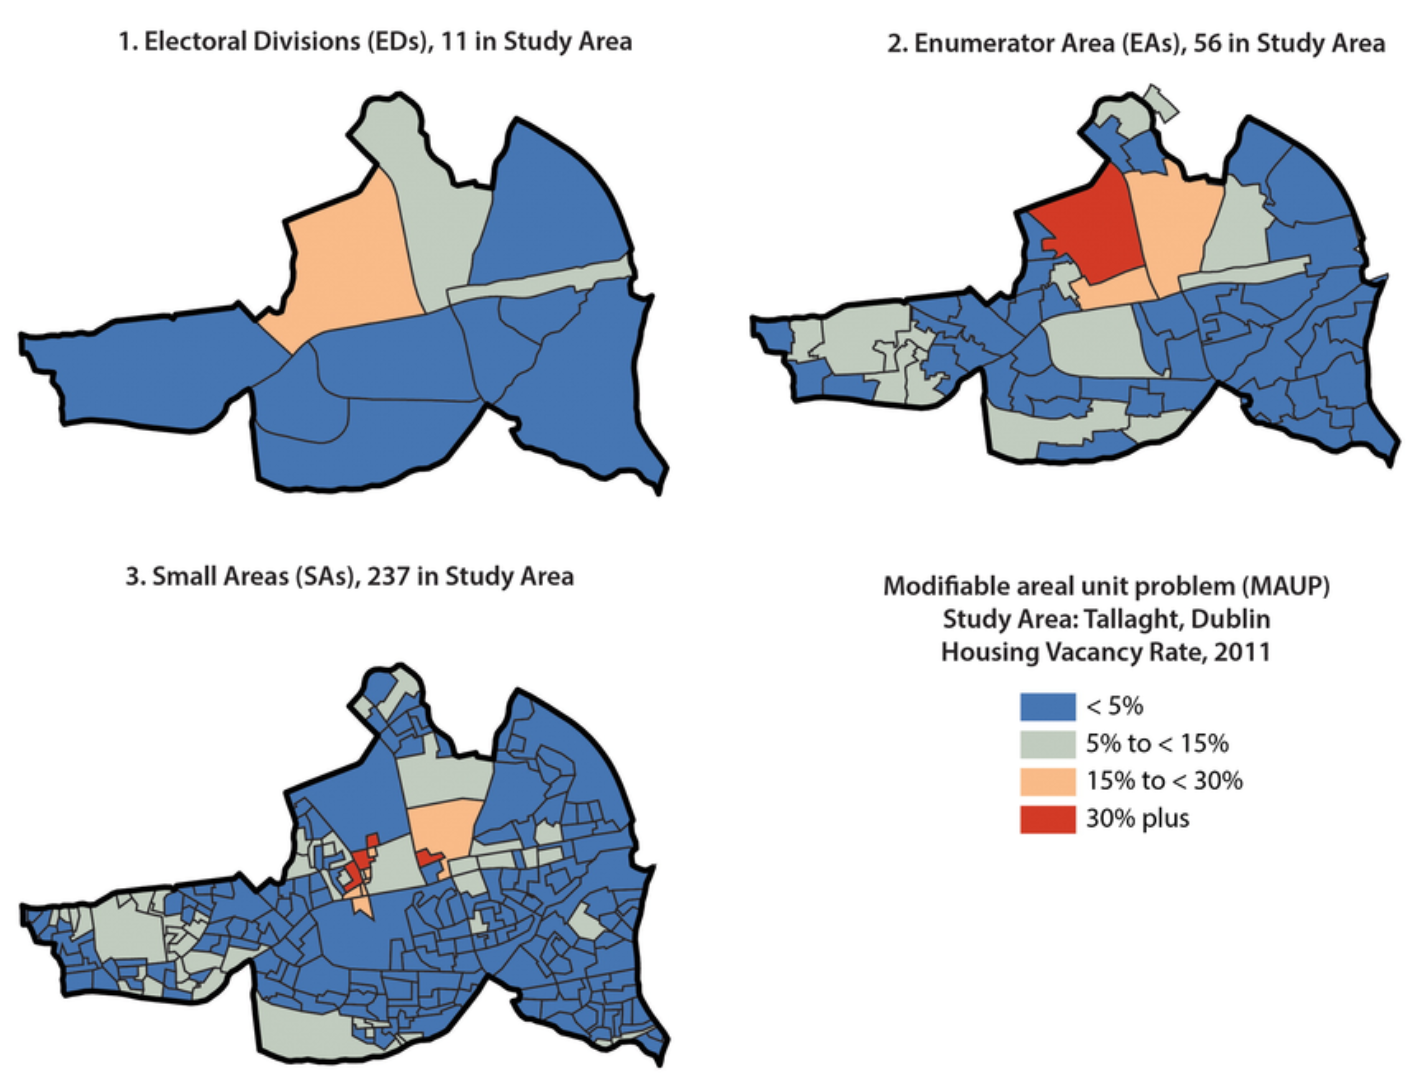
Fig. 136 Visualising the Modifiable Areal Unit Problem: The same indicator represented at three different scales (Source: Kitchin, Rob & Lauriault, Tracey & McArdle, Gavin. (2015). Knowing and governing cities through urban indicators, city benchmarking and real-time dashboards. Regional Studies, Regional Science. 2. 6-28. 10.1080/21681376.2014.983149. )#
2. Proportional circles vs. solid colors#
Caution
Be cautious when representing quantitative data with a solid colour.
While it is graphically appealing, representing quantitative data with solid colours can lead to problems and distract from the message of the map:
You lose the order relationship between the data (a circle can be twice as big as another one, a colour cannot be “twice as dark”)
Countries with a large surface area stand out visually (e.g. Russia in the example below)
We are trying to represent data that has nothing to do with the area of a country
3. Color gradient vs. distinct color palette#
Caution
DO NOT use a separate colour palette to represent ordered entities
A representation that “feels right” because it seems logical that a “low” rate would be represented differently than a “high” rate.
It is a mistake because:
By using a differentiating colour variable, you lose the ordinal relationship between entities. Instead, a gradient of the same colour that should be used.
Different colours are used to differentiate between distinct entities.
4. Gradient in a single colour vs. Gradient between two colours#
Caution
Be cautious when using a gradient across two different colours for data that is always positive (or negative).
This is a difficult because our brains are used to prioritising certain colours, especially green to red, or blue to red. We must remember that if our values do not have a meaningful zero point, it might be better to stay in the same single colour and use different shades of that colour to indicate different values. Alternatively, a colour gradient that is not diverging can be used.
A diverging gradient between two colours can be used when it is necessary to show a gradation that can go from negative to positive. As for temperatures, it makes sense to distinguish negative values (in shades of blue for example) and positive values (in shades of red).
It is a mistake because:
By choosing different colours for values that are linked to each other, our eyes perceive a difference between the elements, and not an order.
Darker colours stand out more than lighter colours, and can be perceived as more important.
The map will send a message of divergence, of opposition between certain values, when we are simply trying to represent a hierarchy between values
In this way, the colour itself directly indicates information about the trend (positive/negative or increasing/decreasing).
5. Limited geometric symbols vs. complex icons and symbols#
Caution
DO NOT use too many symbols in a thematic map
Incorporating a multitude of symbols (and data) for a informative map is a common desire. However, too many symbols can overload the map and reduce the readability of the map. Using too many symbols (especially geometric ones) can make it difficult to read and understand the map.
__The eye can easily distinguish between four to five different symbols. Beyond that, it is difficult to tell elements apart. However, This is a less serious error because it does not convey false information on the map.
It is a mistake because:
It complicates the map and limits its impact.
Sometimes you are forced to represent several symbols, so you must be careful about overlapping points and overloading the map.