Introduction to Remote Sensing and Remote Sensing Data#
What is Remote Sensing?#
Remote sensing can be defined as the set of methods used to obtain information about the Earth’s surface by measuring and interpreting the energy radiated from it. The electromagnetic radiation reflected or emitted by the Earth serves as a carrier of information about the state of the Earth’s surface.
The information provided by the radiation emitted from the Earth’s surface can be measured by sensors mounted on vehicles such as drones, aircraft or satellites, and then stored in the form of gridded image data. A simple form of remote sensing data is an ordinary aerial photograph taken, for example, by a drone. The radiation measured and stored in the form of a grid (in this case a photograph) is the visible spectrum of electromagnetic radiation emitted by the Earth’s surface and the objects on it.
Electromagnetic Radiation and its interaction with the Earths Surface#
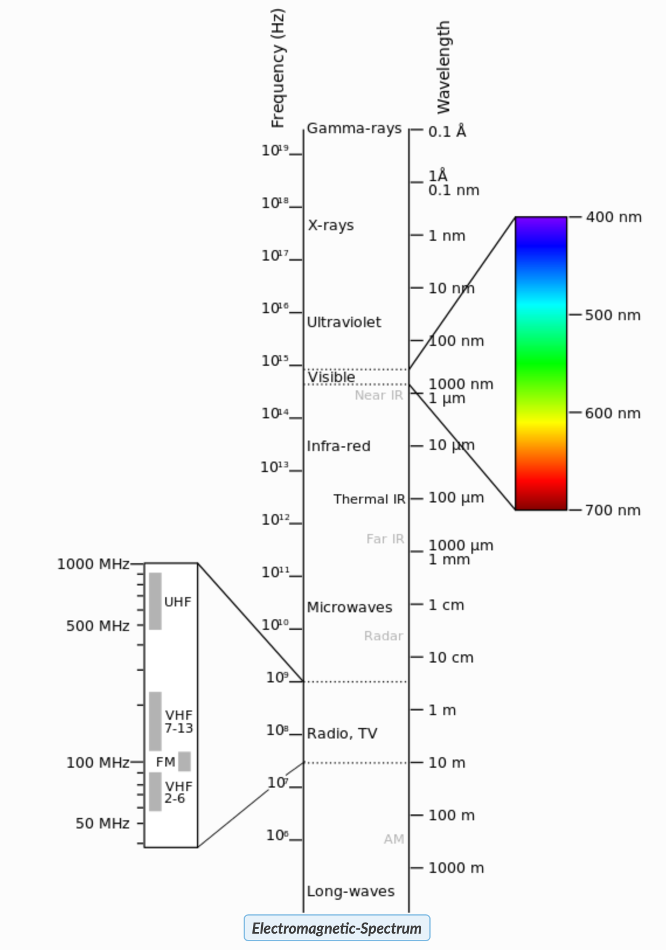
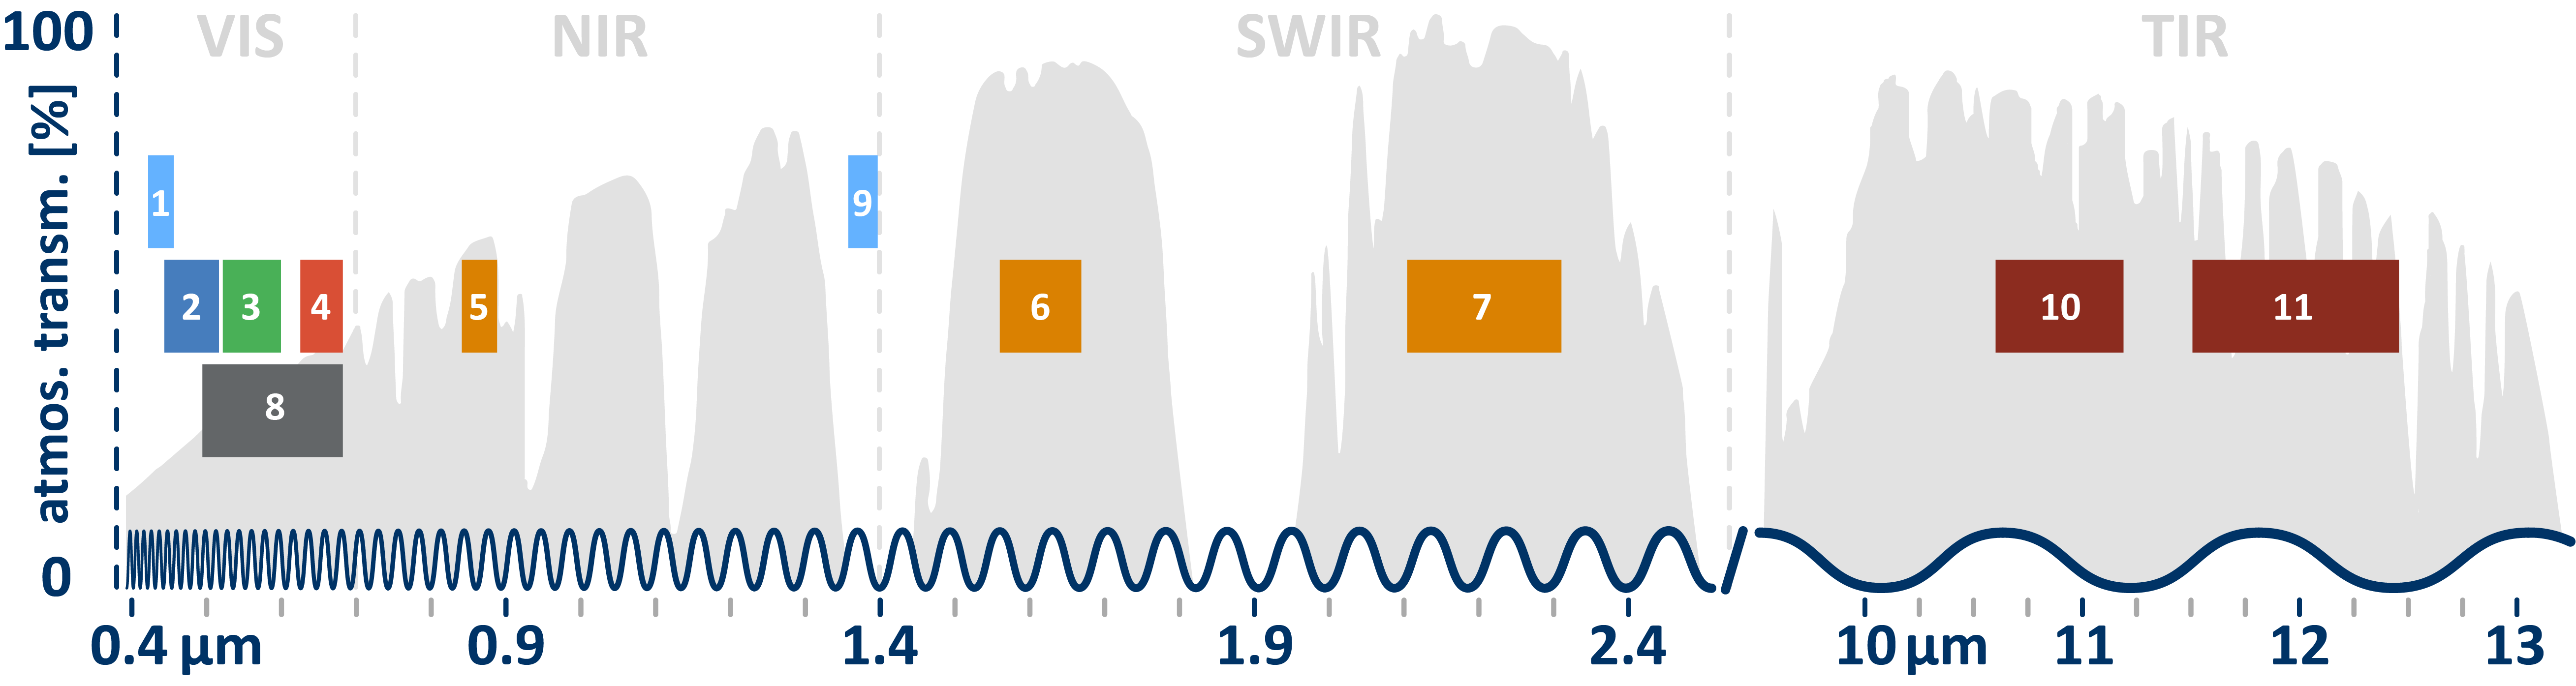
An important component of remote sensing is that different sensors can measure and process a much wider range of electromagnetic radiation than the human eye, which is limited to the visible spectrum. The electromagnetic spectrum can be divided into multiple wavelegth intervals like the visible spectrum, the infra-red spectrum or microwaves (see fig X).
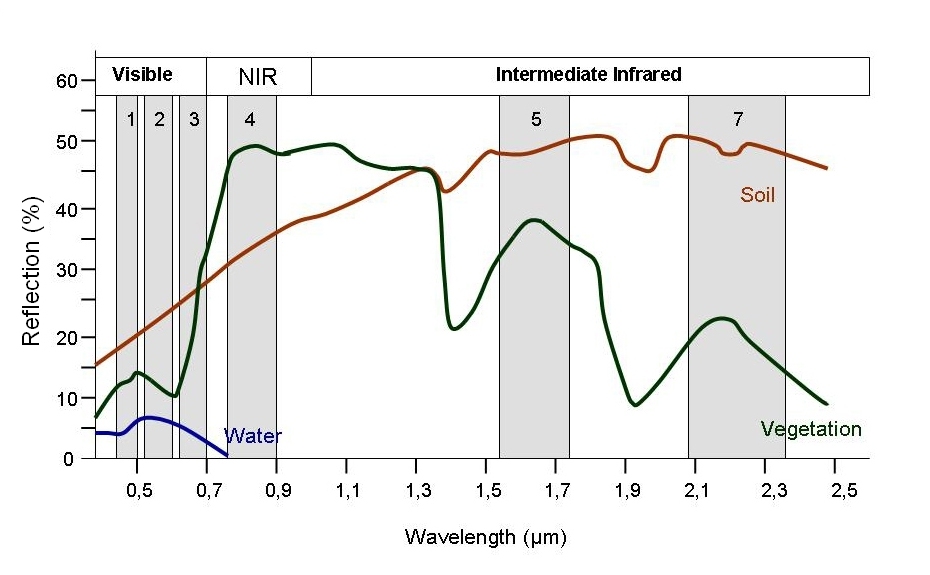
Objects and the Earth’s surface reflect and absorb EMR across the wavelength spectrum and with distinct patterns that are unique to the type of object/surface. These unique patterns are called “spectral signatures” and are visualised in signature graphs. Signatures vary with variations in an object/surface’s material composition, structure and surface properties. For example:
Vegetation typically has a high reflectance in the near-infrared region of the spectrum due to the absorption characteristics of chlorophyll, resulting in a prominent peak in this region.
Water bodies tend to have low reflectance over most of the spectrum, with higher ab-sorption at visible wavelengths and lower absorption in the NIR.
Urban areas can have complex spectral signatures due to the variety of materials pre-sent, such as asphalt, concrete and metal, each with its own reflectance characteristics across the spectrum.
By analysing these spectral signatures it is possible to identify and classify surface features and materials from aerial or satellite imagery. Applications include classification of land cover types, monitoring environmental changes such as deforestation or anthropogenic processes such as urban expansion
Remote Sensing Sensors and Platforms#
The main source of electromagnetic radiation on Earth is the Sun, whose reflected radiation is also the dominant source of information for remote sensing imagery in general. Sensors can measure this electromagnetic radiation in specific ranges, called “bands”, which are usually represented individually by a raster file when acquiring remote sensing data.
For example, the standard data from the Landsat 8 satellite mission, which is one of the most commonly used datasets, has X different bands ranging from X over X to X.
Remote sensing methods can generally be divided into two categories: active and passive remote sensing: If the source of the measured energy is the sun, it is called passive remote sensing and the result of this measurement can be a digital image. However, there is also the possibility of emitting radiation from the sensor platform and then measuring the return reflection. This method can be defined as active remote sensing.

Examples of passive remote sensing include radar sensors that emit microwave radiation or LiDAR sensors that emit laser beams. However, the vast majority of remote sensing data is generated using active remote sensing.
Attributes of Remote Sensing Data#
All general attributes of raster data, such as spatial resolution, extent or the CRS used, presented in the previous module, also apply to remote sensing data, as it is a subcategory of raster data. However, a large proportion of remotely sensed data generally have three more important attributes:
Spectral resolution, which is the number and location in the electromagnetic spectrum of the spectral bands in multispectral sensors. Each band is typically represented by one raster.
Radiometric resolution, usually measured in bits, is the range of brightness values available to quantify the intensity of the measured radiation in a given spectrum. For example, an 8-bit image has 256 levels of brightness.
Temporal resolution is an important attribute of satellite sensors such as Landsat 8 or SENTINEL 2 and can be defined as the period of time required to revisit and measure the same area of the Earth (e.g. 16 days for Landsat 8). It is particularly relevant for the analysis of changes using RS data.
Visulization of Multi Spectral Remote Sensing Data#
The fact that the bands of the individual spectral ranges are available in the files of multispectral remote sensing scenes as individual rasters allows various possible combinations of these bands to create so-called false colour composites: the optical perception of the human eye can be divid-ed into the three spectral ranges of visible light (red, blue and green, R-G-B for short). In a “true colour display”, i.e. the optical display of a satellite image as the human eye would perceive it (e.g. Google Maps Satellite), these bands are also assigned to the corresponding bands: R = Red, G = Green, B = Blue.

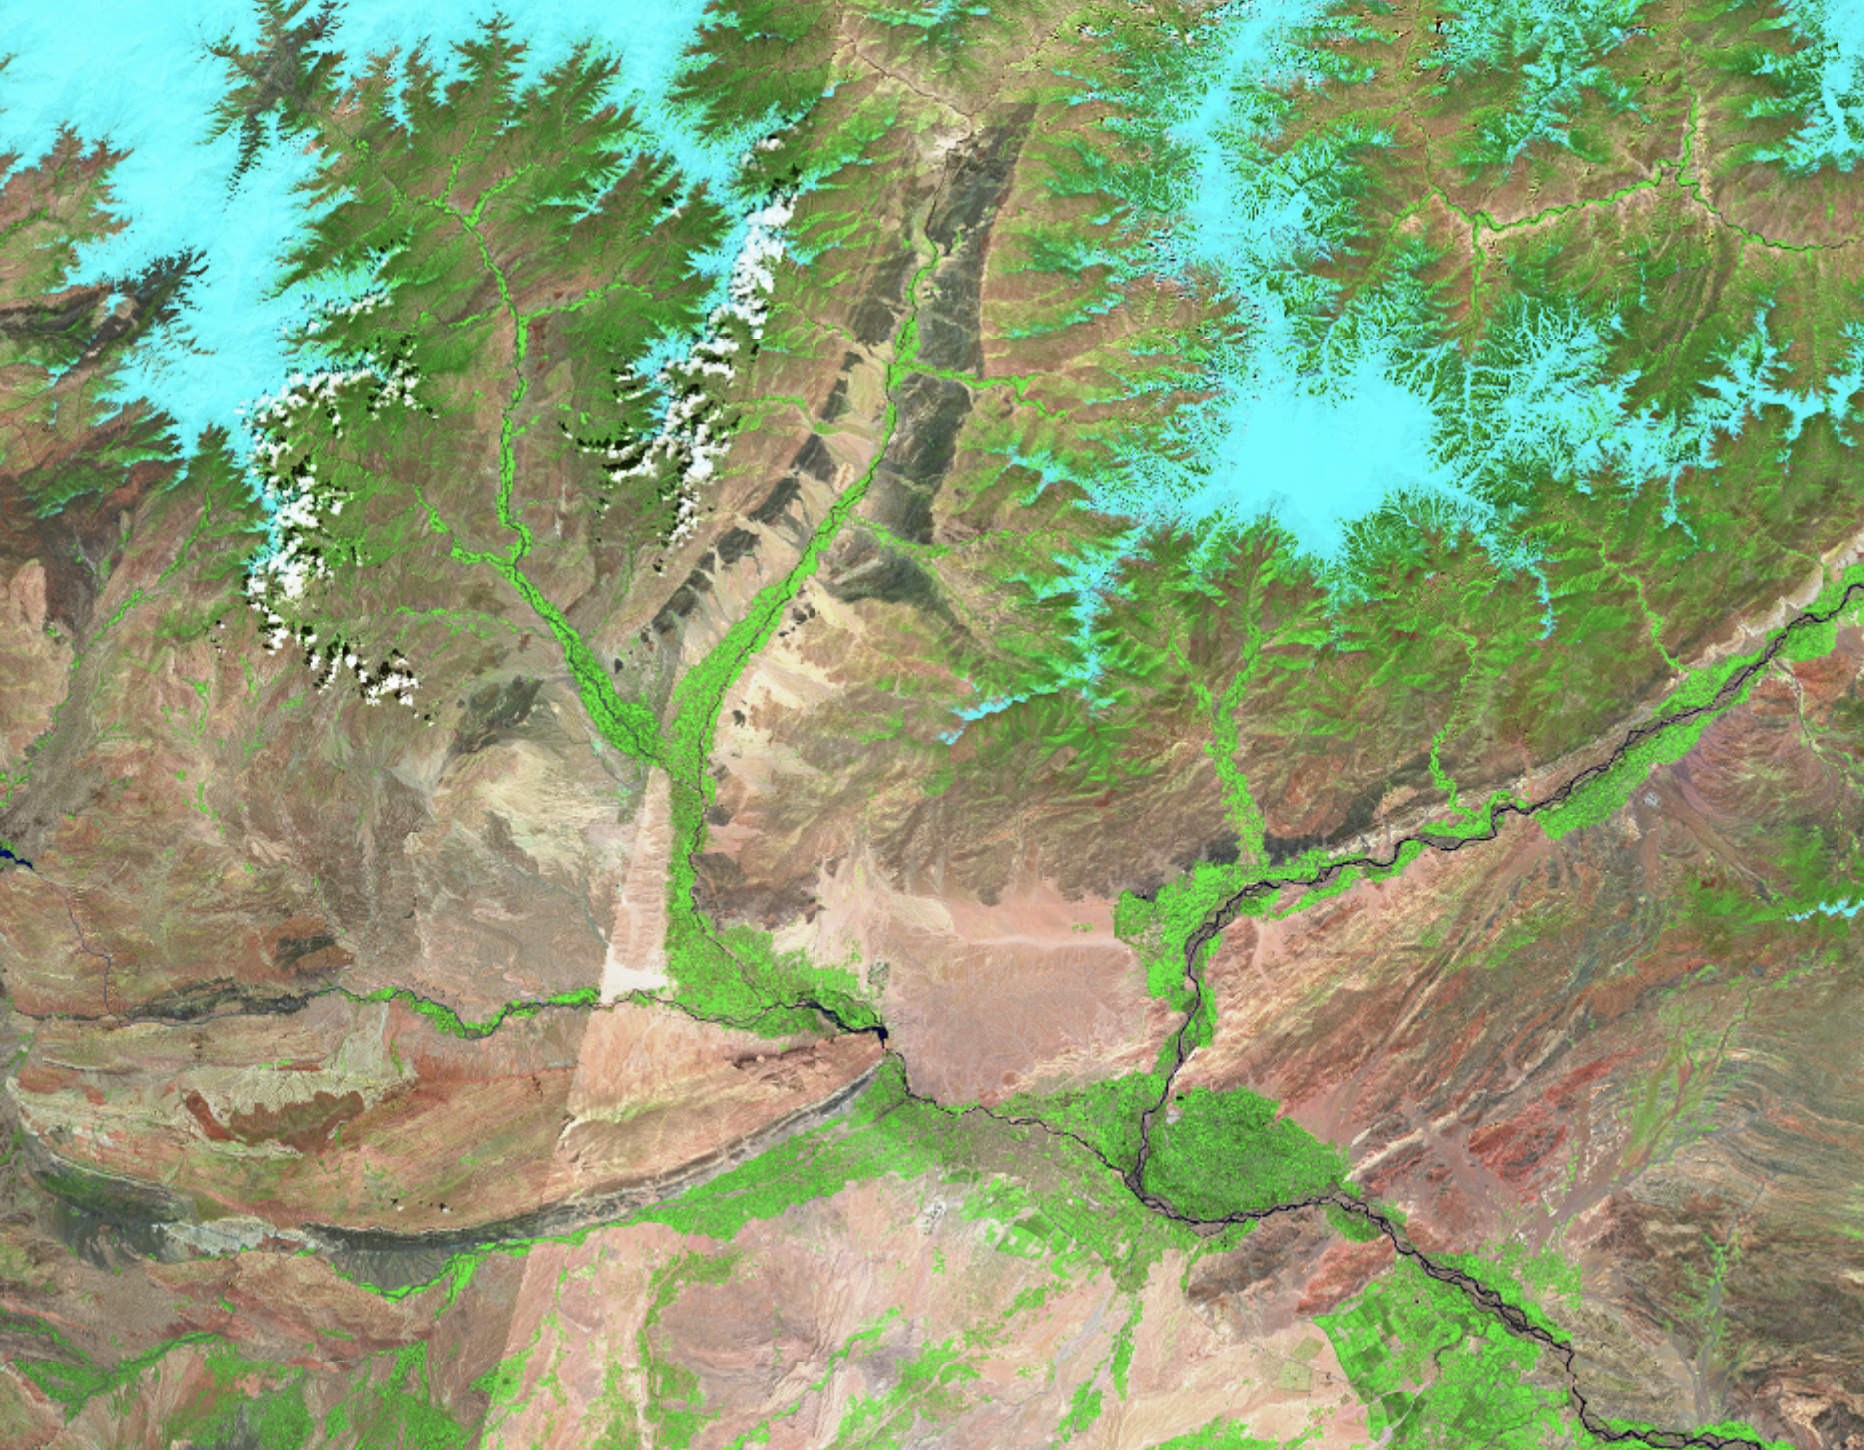
In a false colour image the optical representation of one or more of the bands is not congruent with the spectral bands assigned to it. A commonly used example is the Combination R = Near Infrared, G = Red, B = Green (see Fig X).
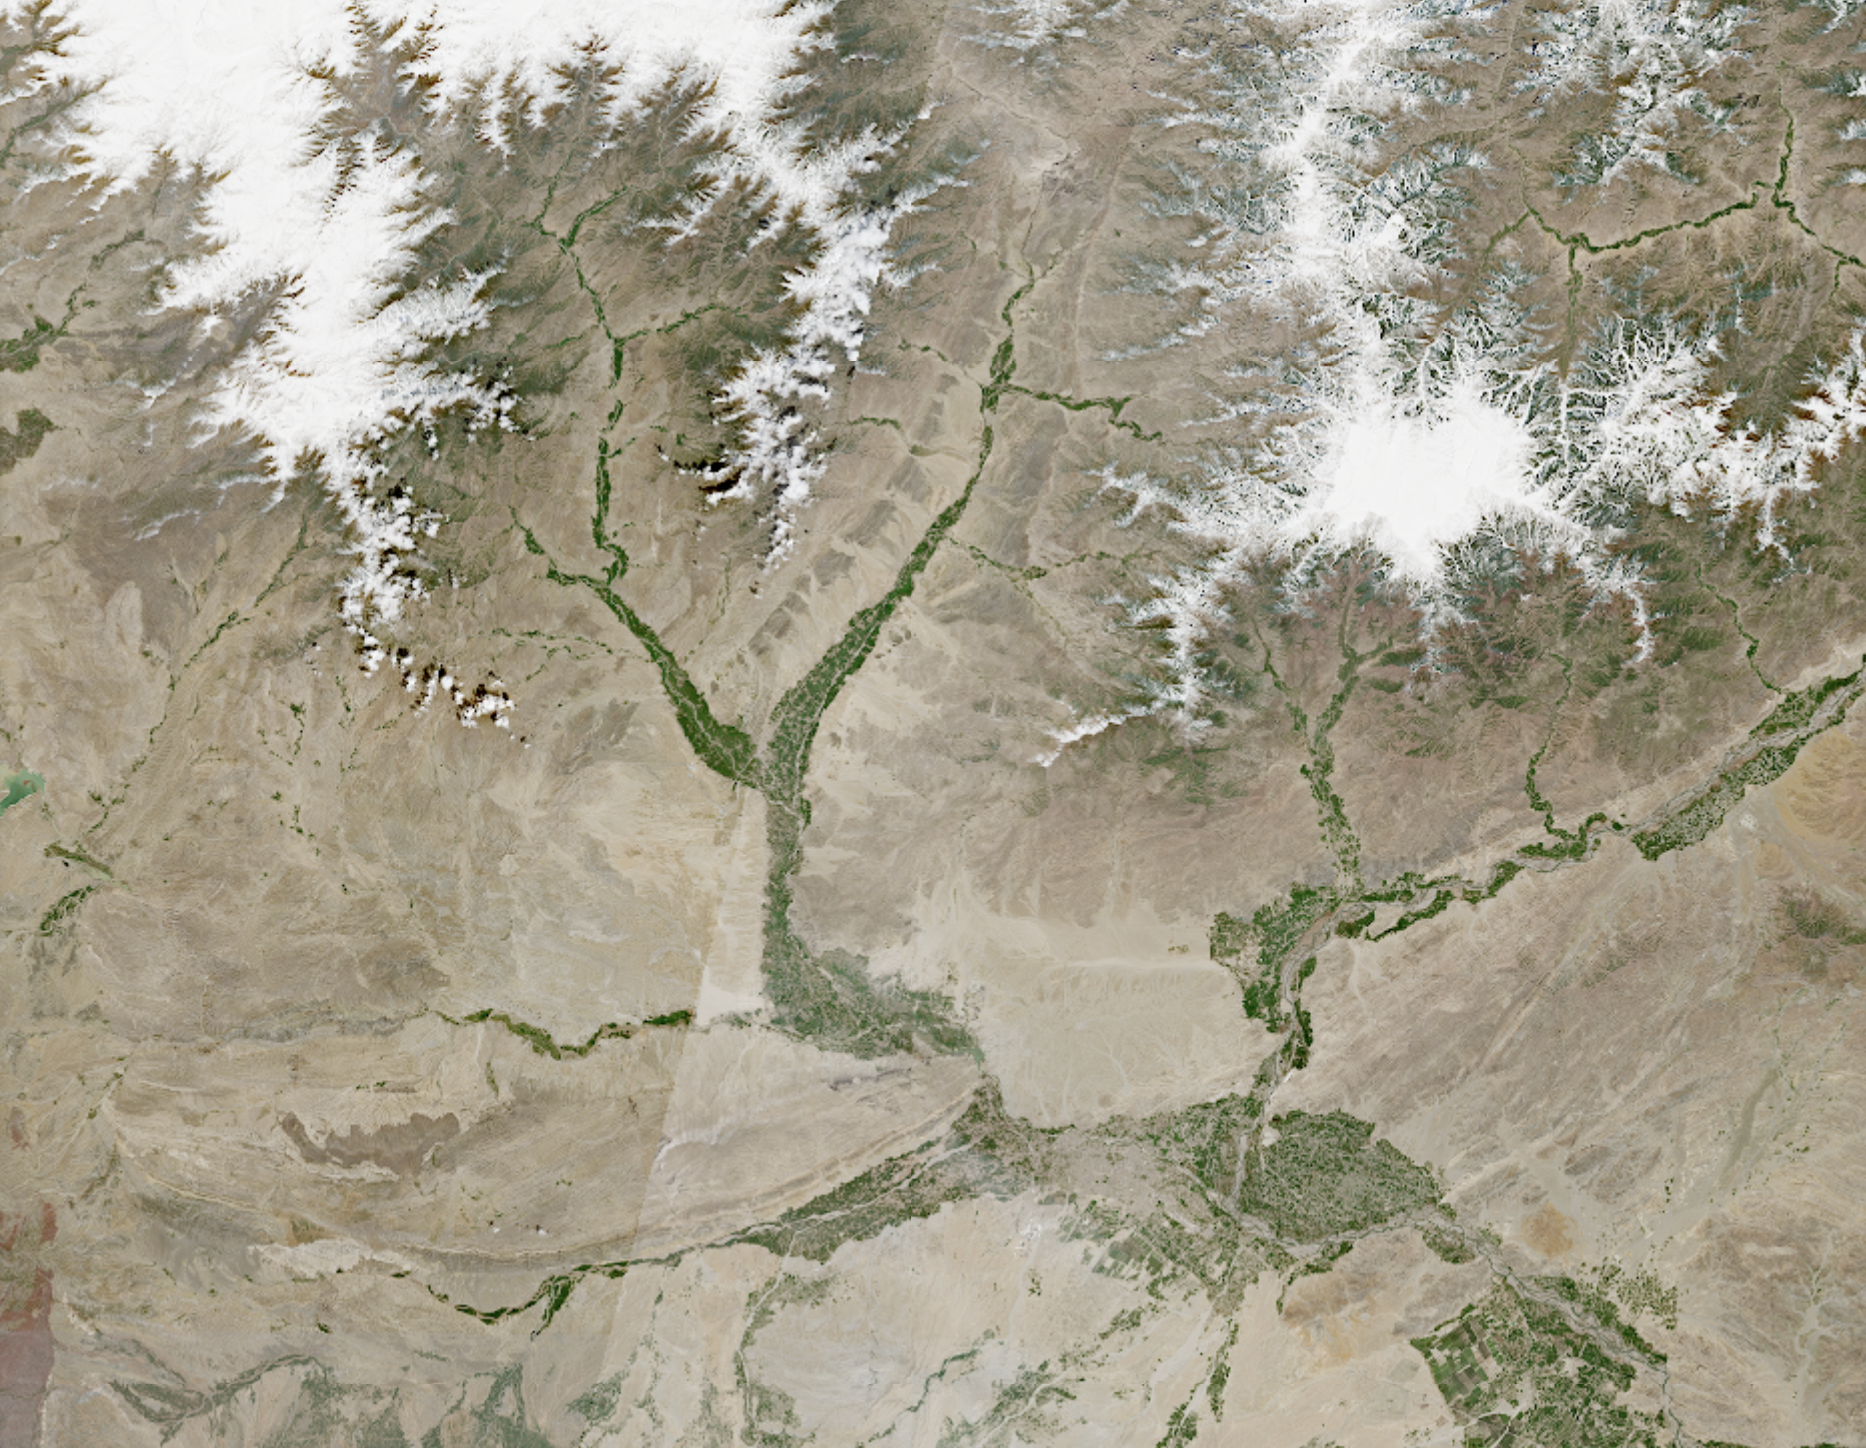
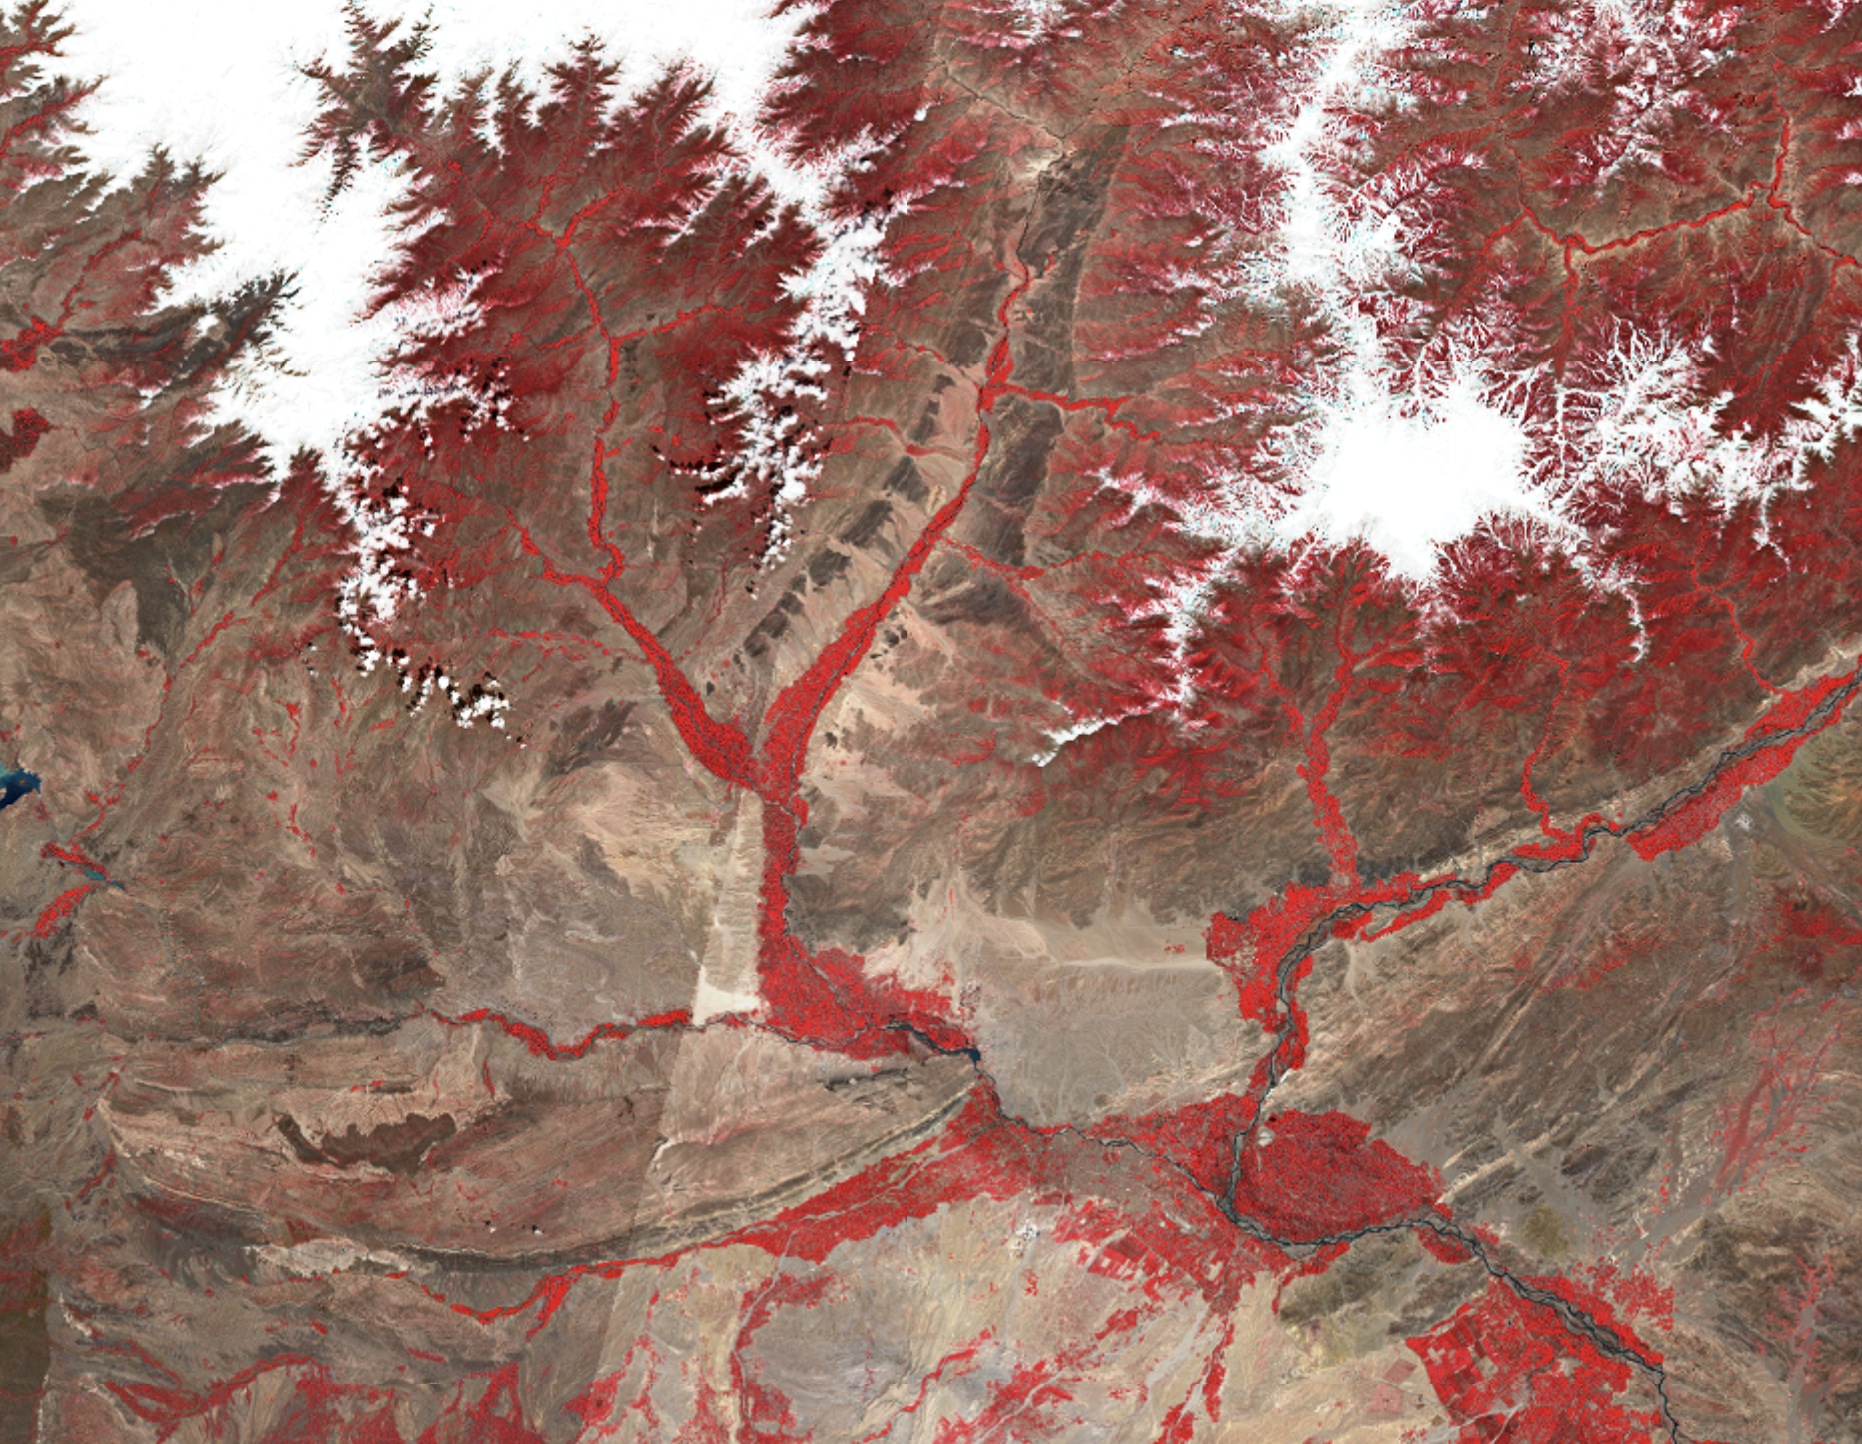
This false colour composit for example strongly highlights vegetation and especially healthy vegetation which appears bright red. This is because red visualizes the near infrared spectrum-which displays high reflectance by vegetation, particularly compared to other surfaces like soil or water. This makes it easier to identify and analyze vegetation cover, health, and distribution.