Exercise 5: Aggregate and Assess G2P Money Transfers in Pakistan#
Characteristics of the exercise#
Aim of the exercise:
The aim of this exercise is to introduce a workflow that combines both spatial and non-spatial processing. A common step is to aggregate data on administrative scales such as adm2 or adm3. This exercise will teach you how to aggregate information about cash transfers on administrative levels and then join the statistics with a polygon data for the administrative boundaries.
Type of trainings exercise:
This exercise can be used in online and presence training.
It can be done as a follow-along exercise or individually as a self-study.
These skills are relevant for
Aggregating and analysing data
Creating situational reports
Estimated time demand for the exercise
~ 60 minutes
Relevant Wiki Articles
Instructions for the trainers#
Trainers Corner
Prepare the training
Take the time to familiarise yourself with the exercise and the provided material.
Prepare a white-board. It can be either a physical whiteboard, a flip-chart, or a digital whiteboard (e.g. Miro board) where the participants can add their findings and questions.
Before starting the exercise, make sure everybody has installed QGIS and has downloaded and unzipped the data folder.
Check out How to do trainings? for some general tips on training conduction
Conduct the training
Introduction:
Introduce the idea and aim of the exercise.
Provide the download link and make sure everybody has unzipped the folder before beginning the tasks.
Follow-along:
Show and explain each step yourself at least twice and slow enough so everybody can see what you are doing, and follow along in their own QGIS-project.
Make sure that everybody is following along and doing the steps themselves by periodically asking if anybody needs help or if everybody is still following.
Be open and patient to every question or problem that might come up. Your participants are essentially multitasking by paying attention to your instructions and orienting themselves in their own QGIS-project.
Wrap up:
Leave time for any issues or questions concerning the tasks at the end of the exercise.
Leave some time for open questions.
Step-by-step instructions#
Click here to download the datasets for this exercise.
Available Data:
G2P_disbursement_report_cleaned.csv- Data table with cash transactions. This dataset has been cleaned and all personal information has been removed.pak_admbnda_adm2_wfp_20220909.shp- Administrative boundaries on adm2 level (districts).
Preparing the data#
Unzip the exercise data and create a new QGIS-project.
Load the data into your QGIS-project.
Let’s familiarise ourselves with the data. Open the attribute table of each layer and see what kind of information is stored in the datasets.
Note
We want to aggregate the information about money transactions on adm3- or adm2-level. Can you identify which column in the G2P_disbursement_report_cleaned-layer corresponds to adm2 and adm3?
Solution
By comparing the values in the column admin2_EN from the pak_admbnda_adm2_wfp_20220909-layer, we can see that the column var_attr_03 corresponds to the admin2-level in the G2P_disbursement_report_cleaned-layer. By sorting the layers alphabetically, it is easier to find matching values in both attribute tables.
Step 1: Aggregating the amount of transferred money on admin2#
In the processing toolbox, search for the tool
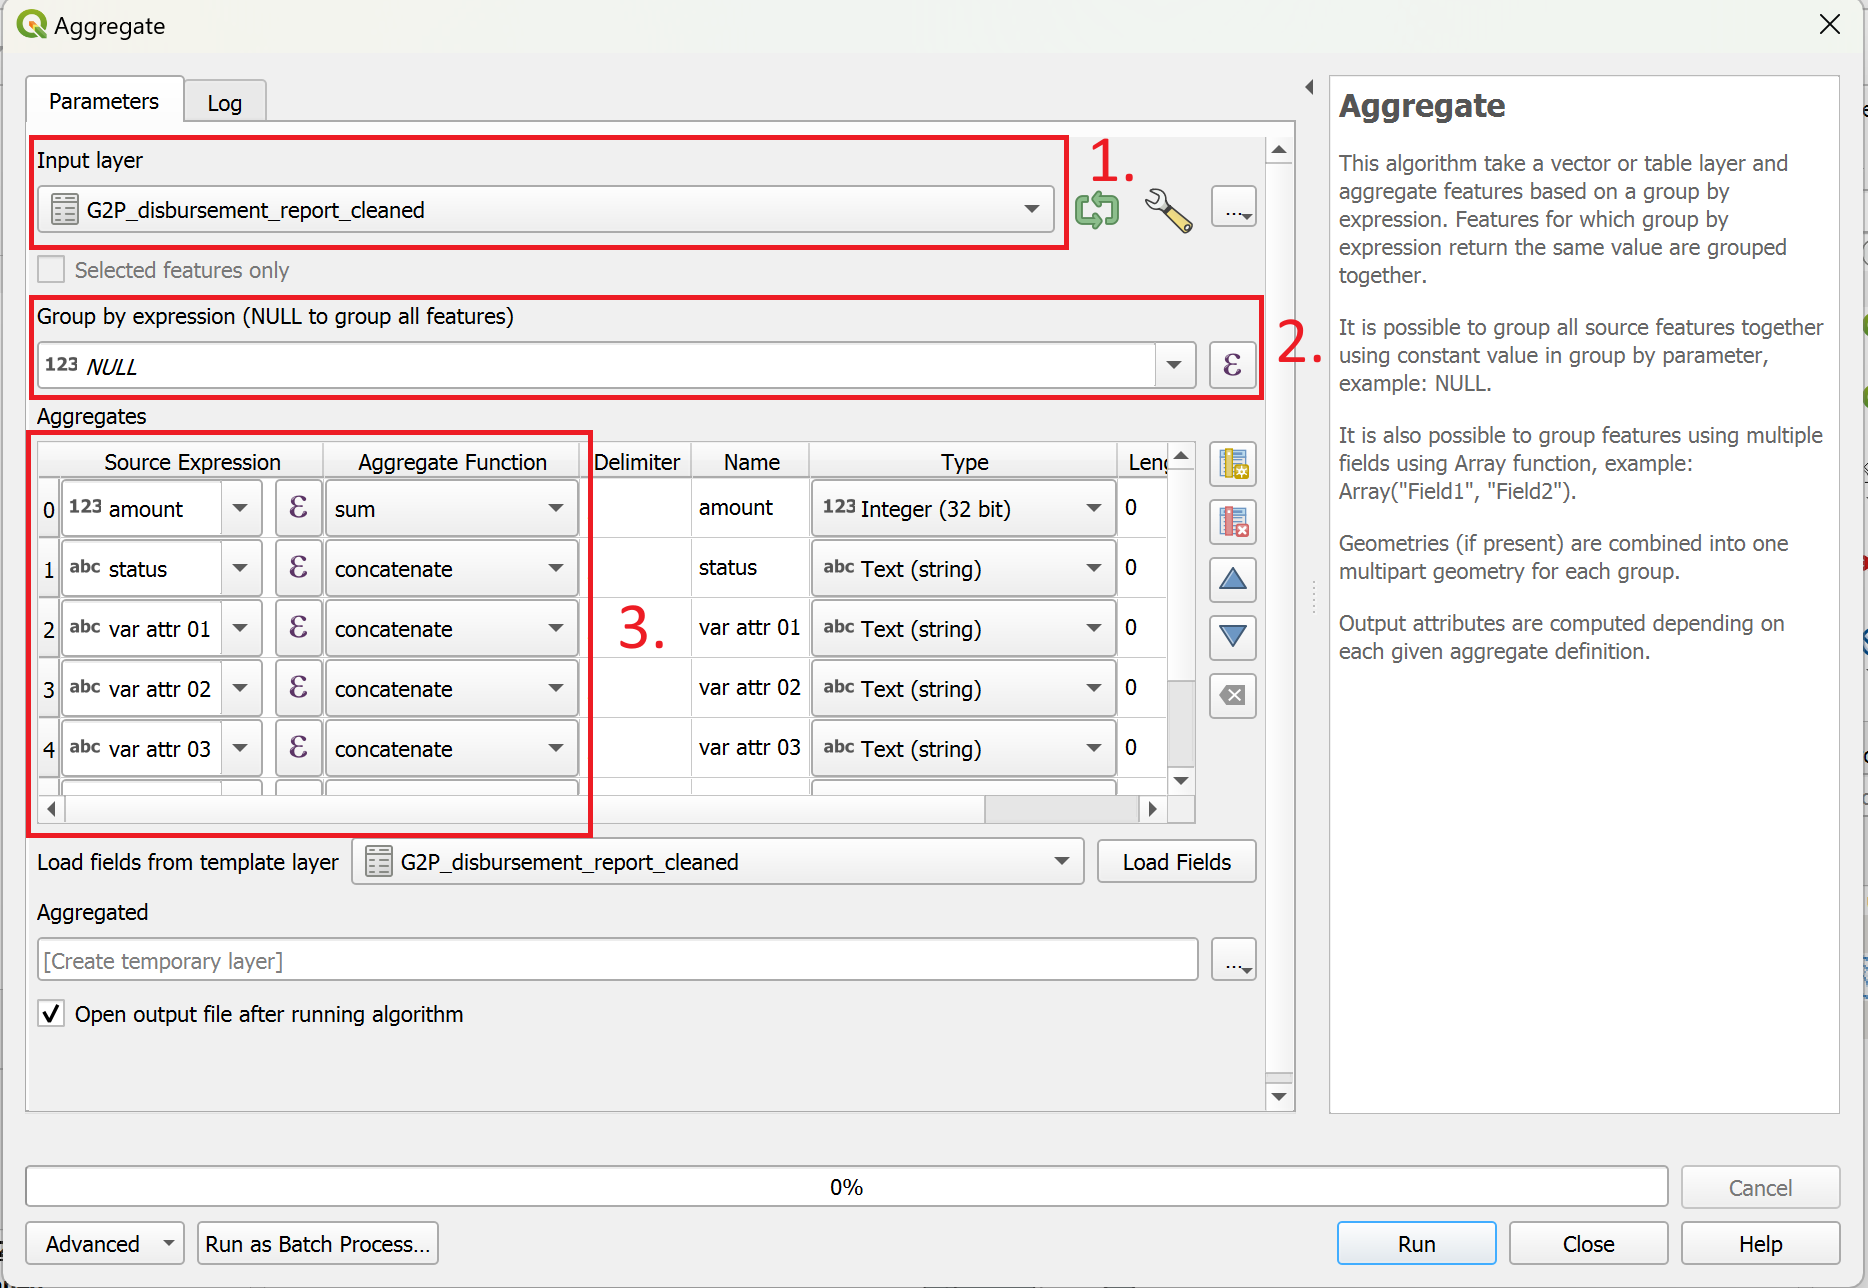
AggregateunderVector Geometry. Double-Click on it. A new window will open (seeaggregate_tool).

The Aggregate-tool in QGIS 3.36#
In the “Aggregate”-window,
Select the
G2P_disbursement_report_cleaned-layer as input layer.Group by Expressionis where we select which column we want to have grouped (or selected as category). We want to identify the amount of money transferred to each district (admin2-level), so we need to select the corresponding column. In our case, this is the columnvar_attr_03.This box is where we select how the tool aggregates the different columns:
We want to calculate the
Sumfor the column “Amount”.For the column “var attr 03” we want to select
Concatenate_unique. This returns all unique strings from a field.The other columns can be set to
concatenate_unique
Click
Run. A new layer called “Aggregated” will appear in the layers-panel. Close the “Aggregate”-window.

Adjust the aggregation function for the relevant columns. Pay attention that the
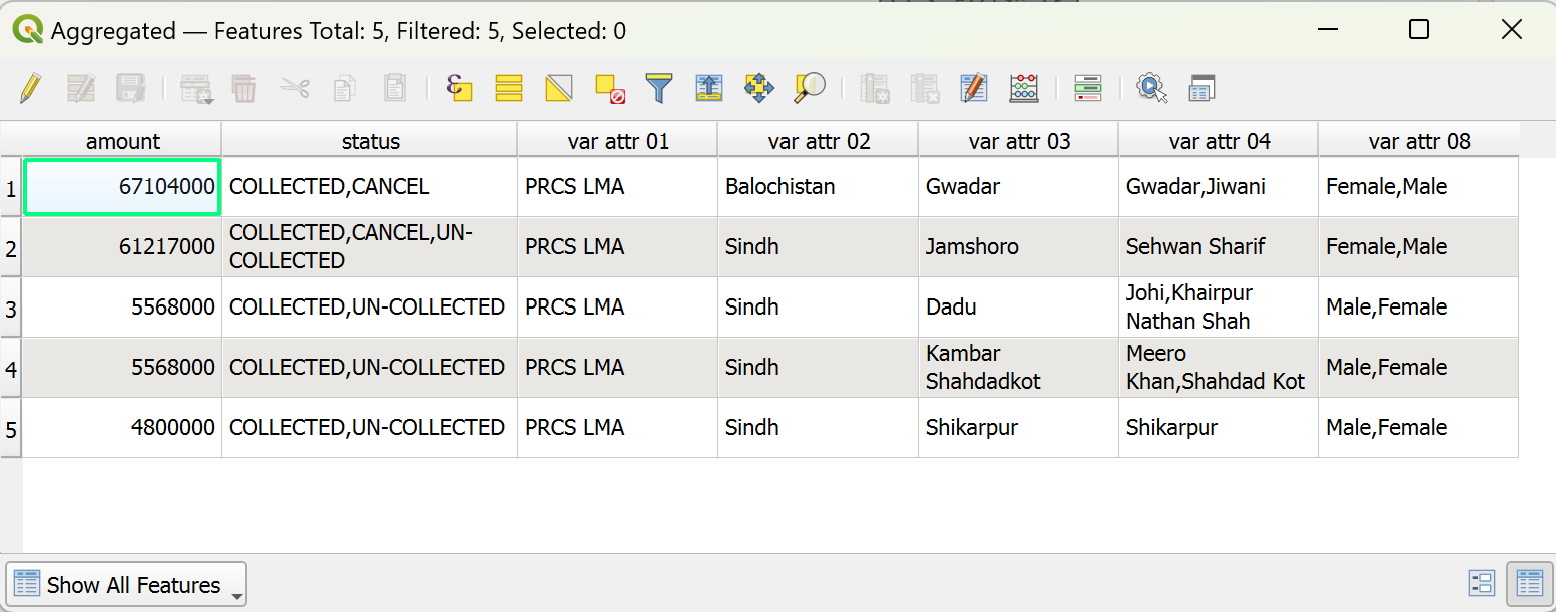
Typefor the amount is set to “Integer”. If you have imported the table correctly into QGIS, this should be set automatically.#Let’s take a look at the new layer by opening the attribute table. If you have done everything correctly, the table should look like
aggregate_results. We can see on row for each distinct value in thevar attr 03column (Gwardar, Jamshoro, Dadu, Kambar Shahdadkot, Shiparpur). In the columnAmountwe see the sum of all the individual transfers. In the other columns, we can see a string with the different values of the original table separated by commas (e.g. the different admin3-units, Thesils, under the columnvar attr 04).

The aggregated data from
G2P_disbursement_report_cleaned#
Step 2: Joining the aggregated data with administrative boundaries#
In this step, we want to add the aggregated information we gained from the CSV file to the administrative boundaries. We need to join the aggregated table with the pak_admbnda_adm2_wfp_20220909-layer.
In the processing toolbox, search for
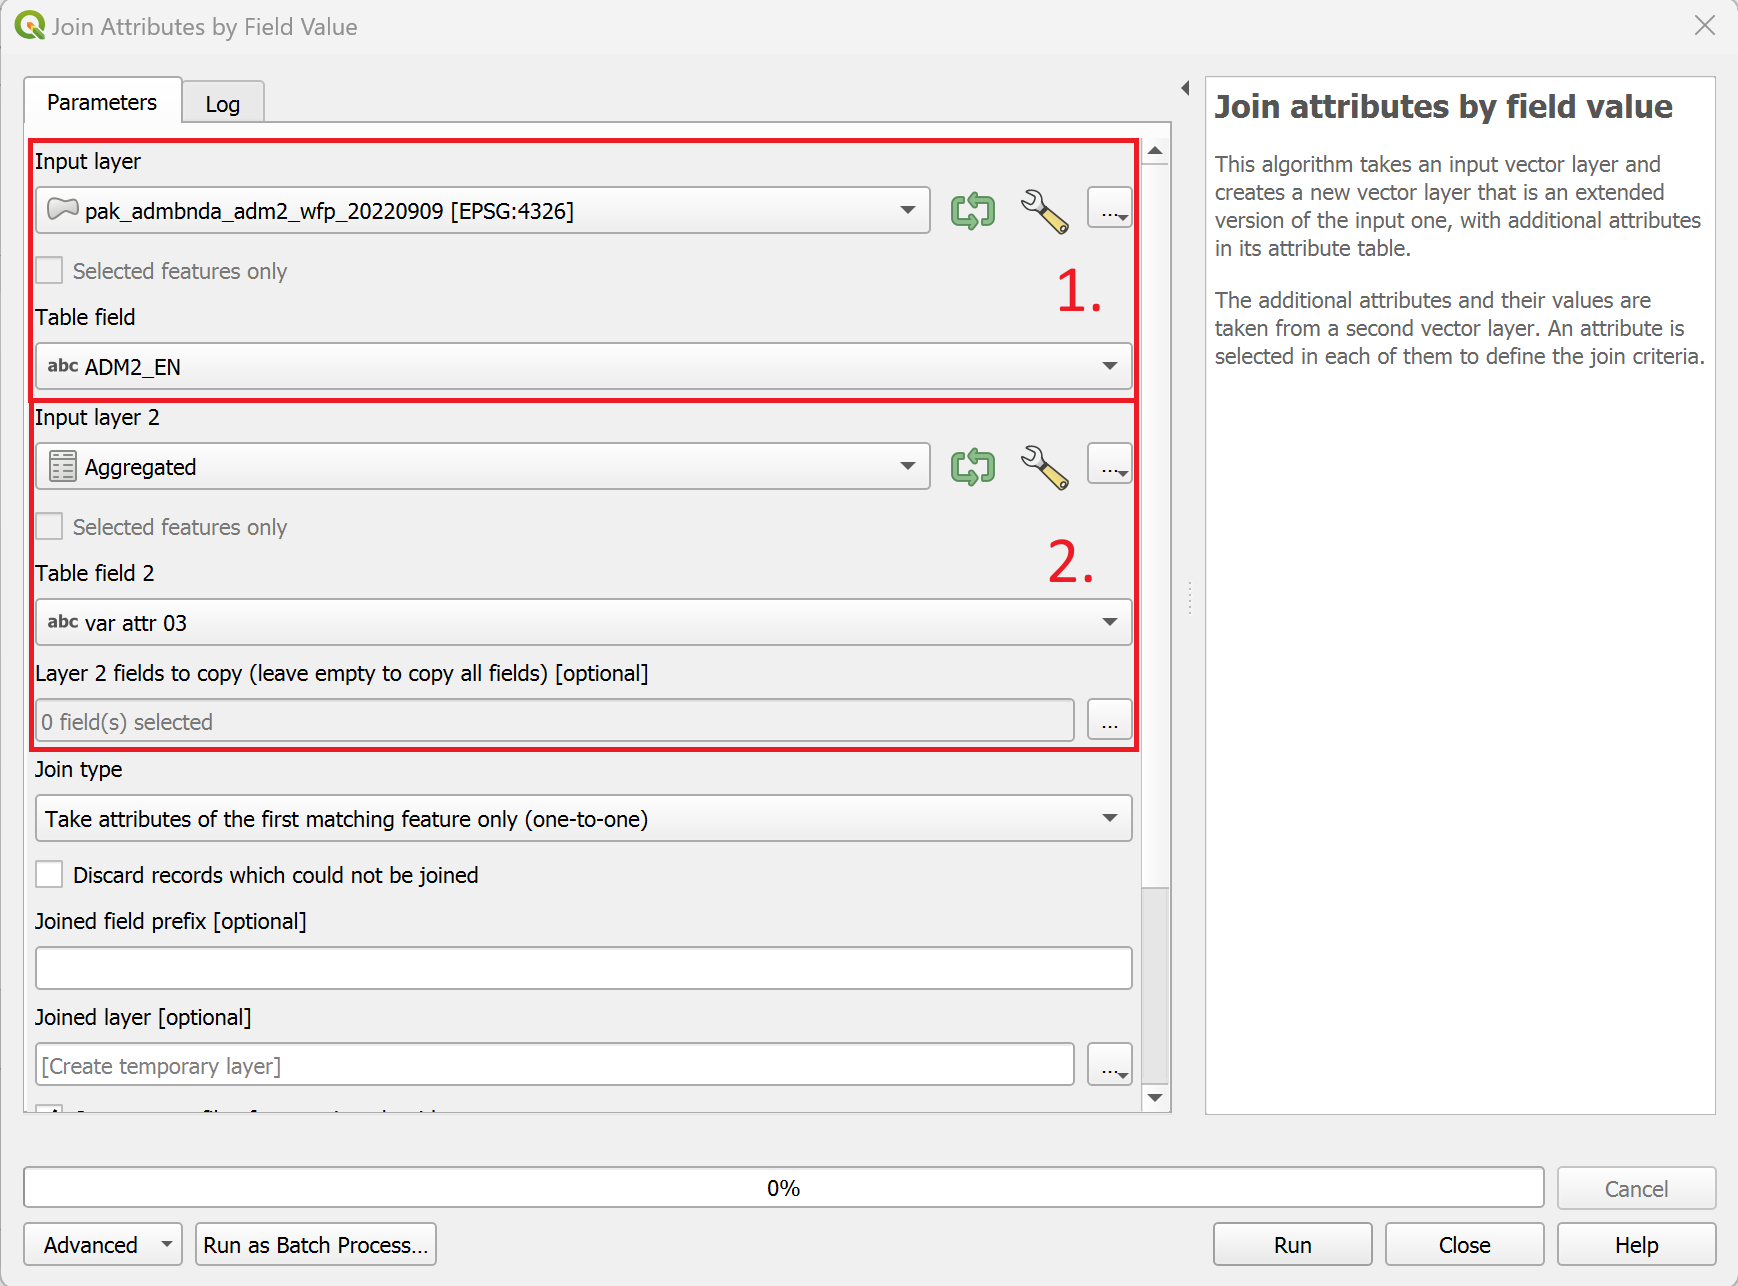
Join attributes by field value. Double click on it. A new window will open.
The Join attributes by field value dialogue box in QGIS 3.36.#
The input layer should be
pak_admbnda_adm2_wfp_20220909-layer. This will be the layer that will receive additional information. The geometries of the input layer will be preserved. TheTable fieldshould be set to “ADM2_EN”. These are english names for the admin2-level.The second input layer should be the
Aggregatedlayer from the previous step.Table field 2should also be the english names for the administrative boundaries. In our case, the corresponding column is “var attr 03”. UnderLayer 2 fields to copy, only selectamountas we are not interested in the other values.
Click
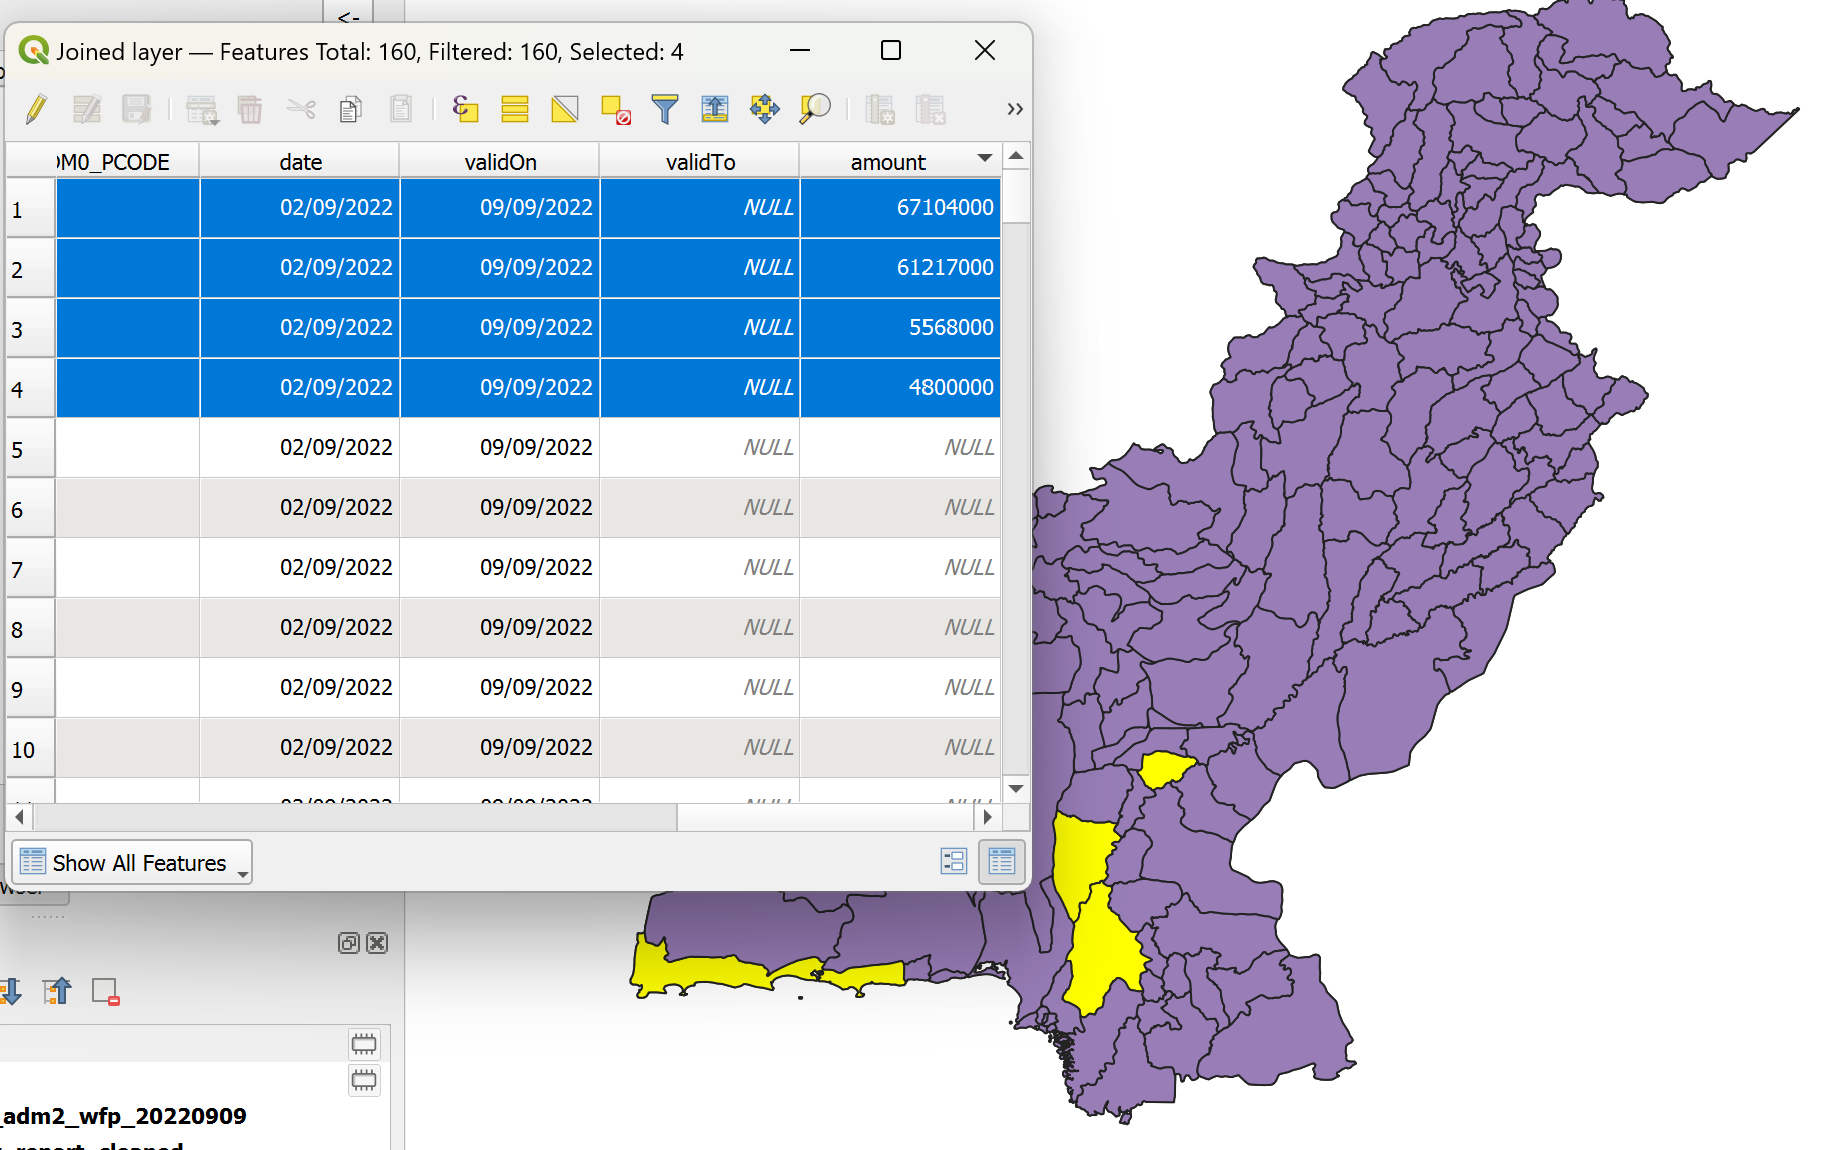
Run. A new layerJoined Layerwill appear in the layer-panel.Close the joining dialogue window and investigate the new layer by opening it’s attribute table. Scroll the right to find the new column “amount” that has been joined.
Notice how most of the rows have
NULLas their value in this column? This is because the aggregated table only has 5 distinct districts (adm2) that received money. You can sort the table by clicking on the column header.
Congratulations, we have successfully joined a CSV-file with a polygon layer!

The aggregated amount joined to a layer of the administrative boundaries.#