Exercise 3: Data sources#
Characteristics of the exercise#
Aim of the exercise
The aim of this exercise is to navigate various data sources, gain an understanding of where and how to access relevant data, and identify potential problems. It is important to use reliable, up-to-date, and appropriate data sources** that fit the purpose of the analysis to ensure a successful and meaningful results. Always consider your analysis objectives and requirements and search for data accordingly.
Type of trainings exercise:
This exercise can be used in online and presence training.
These skills are relevant for
QGIS Essentials
Finding and downloading relevant datasets and preparing them for further analysis
Estimated time demand for the exercise.
The exercise takes around 1 hour to complete, depending on the number of participants and their familiarity with computer systems.
Relevant Wiki articles
Instructions for the trainers#
Trainers Corner
Prepare the training
Take the time to familiarise yourself with the exercise and the provided material.
Prepare a white-board. It can be either a physical whiteboard, a flip-chart, or a digital whiteboard (e.g. Miro board) where the participants can add their findings and questions.
Before starting the exercise, make sure everybody has installed QGIS and has downloaded and unzipped the data folder.
Check out How to do trainings? for some general tips on training conduction
Conduct the training
Introduction:
Introduce the idea and aim of the exercise.
Provide the download link and make sure everybody has unzipped the folder before beginning the tasks.
Follow-along:
Show and explain each step yourself at least twice and slow enough so everybody can see what you are doing, and follow along in their own QGIS-project.
Make sure that everybody is following along and doing the steps themselves by periodically asking if anybody needs help or if everybody is still following.
Be open and patient to every question or problem that might come up. Your participants are essentially multitasking by paying attention to your instructions and orienting themselves in their own QGIS-project.
Wrap up:
Leave time for any issues or questions concerning the tasks at the end of the exercise.
Leave some time for open questions.
Exercise#
Available Data#
Since the exercise is about finding data, there won’t be any data to download. Instead download the usual folder structure here and insert your data as you download it.
Tasks#
The objective of this exercise is to find out how many hospitals are located in Bolivia and how they are distributed across the country.
Find a data source to download the administrative boundaries and healthsites of Bolivia. The following instructions are designed for the example of Bolivia. If you wish to perform the same analysis for another country, some instructions may differ, but the general workflow will remain the same.
Possible data sources
Test downloading the administrative boundaries on OSM Boundaries and the healthsites on healthsites.io.
Download the data and save the administrative boundaries as
boliviaand the healthsiteshealthsites_boliviainto thedata\inputfolder.
Note
Make sure to only use the point data from the healthsites dataset. Other data shapes such as lines or polygons can be ignored in this example. Depending on the data source, information can be provided as points, but also as lines or polygons.
Load both vector files into QGIS.
Now add the OpenStreetMap basemap via the browser window >
XYZ Tiles. Adding basemaps can help you orient yourself, gain a better understanding of the area of interest, and create more informative maps.Familiarise yourself with the data by opening the attribute table and identify the different types of healthcare that are included in the dataset. Get an overview of the information that is stored in each column. For example, there could be information indicating the type of healthsite.
If your dataset contains information about the type of healthsite (e.g. clinic, hospital, doctor, etc.), we can extract these and save them in a new layer. We can do this by selecting the hospitals and then copying them to a new layer.
Hint
For information on how to easily filter your data by manually selecting features in the attribute table after it has been sorted based on a particular column, see the attribute table page on the wiki.
To view only the selected features (hospitals) and apply the filtering, we can first display these features in the attribute table by clicking on
Show Selected Featuresin the bottom left corner, and then export only the selected features and save them ashospitals_boliviain yourdata\outputfolder.Save your project and display your results. Ensure that both the country of Bolivia and the hospitals are visible.
Result#
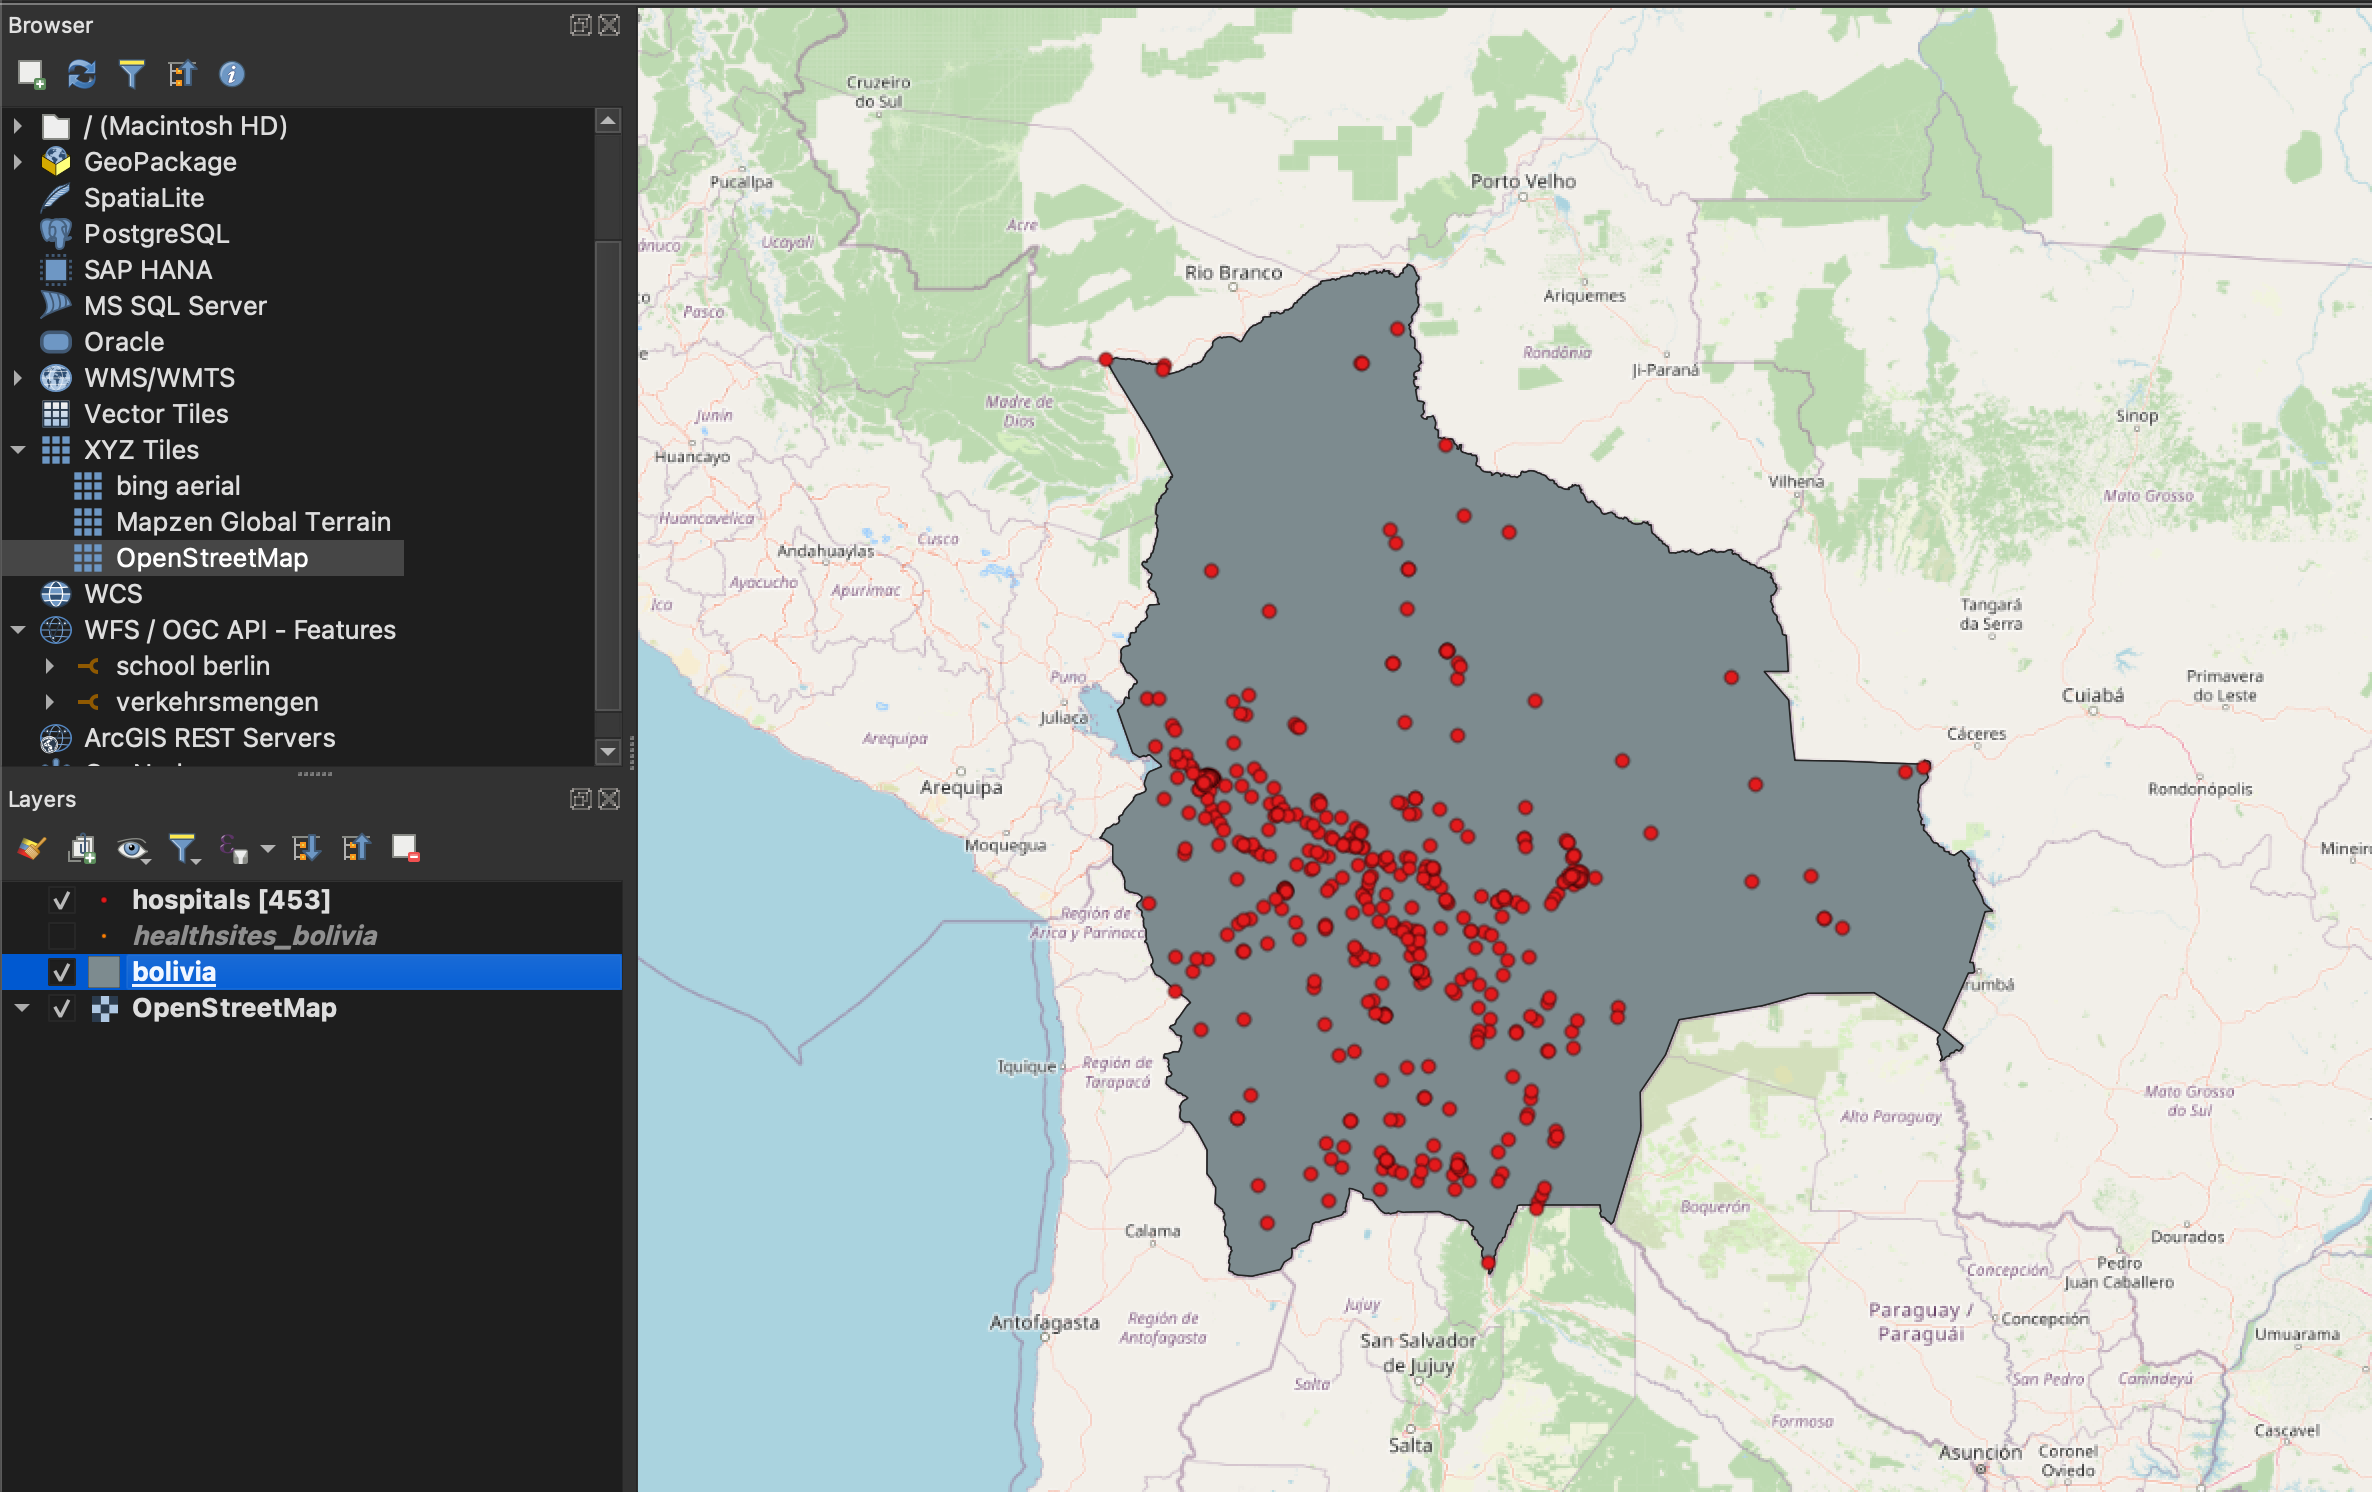
Your map could look like this when you have finished the exercise.#
The distribution of hospitals across Bolivia is uneven. It is noticeable that there are significantly less hospitals in the northern and eastern parts of Bolivia.