Exercise 2: Basic geodata processing#
Characteristics of the exercise#
Aim of this exercise:
The objective of this exercise is to get a feeling for geodata and start working with it. Understand the attribute table, sort it, select manually and export the selection, as well as load a basemap
Type of trainings exercise:
This exercise can be used in online and presence training.
It can be done as a follow-along exercise or individually as a self-study.
These skills are relevant for
QGIS Essentials
Navigating the QGIS-interface
Sorting and manipulating datasets through the attribute table
selecting the correct projections
performing basic and advanced spatial analyses
Estimated time demand for the exercise.
The exercise takes around 1 hour to complete, depending on the number of participants and their familiarity with computer systems.
Relevant Wiki articles
Instructions for the trainers#
Trainers Corner
Prepare the training
Take the time to familiarise yourself with the exercise and the provided material.
Prepare a white-board. It can be either a physical whiteboard, a flip-chart, or a digital whiteboard (e.g. Miro board) where the participants can add their findings and questions.
Before starting the exercise, make sure everybody has installed QGIS and has downloaded and unzipped the data folder.
Check out How to do trainings? for some general tips on training conduction
Conduct the training
Introduction:
Introduce the idea and aim of the exercise.
Provide the download link and make sure everybody has unzipped the folder before beginning the tasks.
Follow-along:
Show and explain each step yourself at least twice and slow enough so everybody can see what you are doing, and follow along in their own QGIS-project.
Make sure that everybody is following along and doing the steps themselves by periodically asking if anybody needs help or if everybody is still following.
Be open and patient to every question or problem that might come up. Your participants are essentially multitasking by paying attention to your instructions and orienting themselves in their own QGIS-project.
Wrap up:
Leave time for any issues or questions concerning the tasks at the end of the exercise.
Leave some time for open questions.
Exercise#
Available Data#
Download all datasets here, save the folder on your computer and unzip the file. The zip folder includes:
nigeria_populated_places.shp(Points) Shapefilenigeria_boundaries.geojsonGeoJSON
The shapefile for populated places contains data on human settlements in Nigeria, including cities, villages and others. The GeoJSON file for the boundaries of Nigeria contains information on the administrative boundaries at levels 2 and 4 with level 2 representing the whole country and level 4 being the states.
Tasks#
Load both files into QGIS.
Add the OpenStreetMap basemap via the browser panel –> XYZ Tiles.
Familiarise yourself with the data by opening the attribute table. Determine the location of the data and the type of information it contains. Understand the different columns and the data they contain in your attribute table and try to get an overview of which columns will be relevant and important for your analysis.
In the
nigeria_populated_placeslayer, open the attribute table, select the feature for Zuyel, and zoom to the selected point.
Hint
The place starts with a Z so it might help to sort the name column in
descending order.
Export Zuyel as its own GeoPackage. Check the projection and choose an appropriate CRS. Name it
zuyel.gpkg.
Note
As no calculations are involved, e.g. area, WGS84 (EPSG:4326) is a good choice.
How do I know which CRS to choose?
EPSG.io has a database that you can search to find the appropriate CRS to use for a country. More information on projections can be found in the Wiki or in the corresponding section in module 2 on projections.
Repeat the steps for the layer
nigeria_boundaries.geojsonand only export the district in which Zuyel is located. Name it accordingly. To find the district use the
Identify Featurestool and then manually select the correct district in the attribute table.
Remove all the initial layers and then open the attribute table for each of your new layers and check that each layer only contains one feature.
Save your project.
Result#
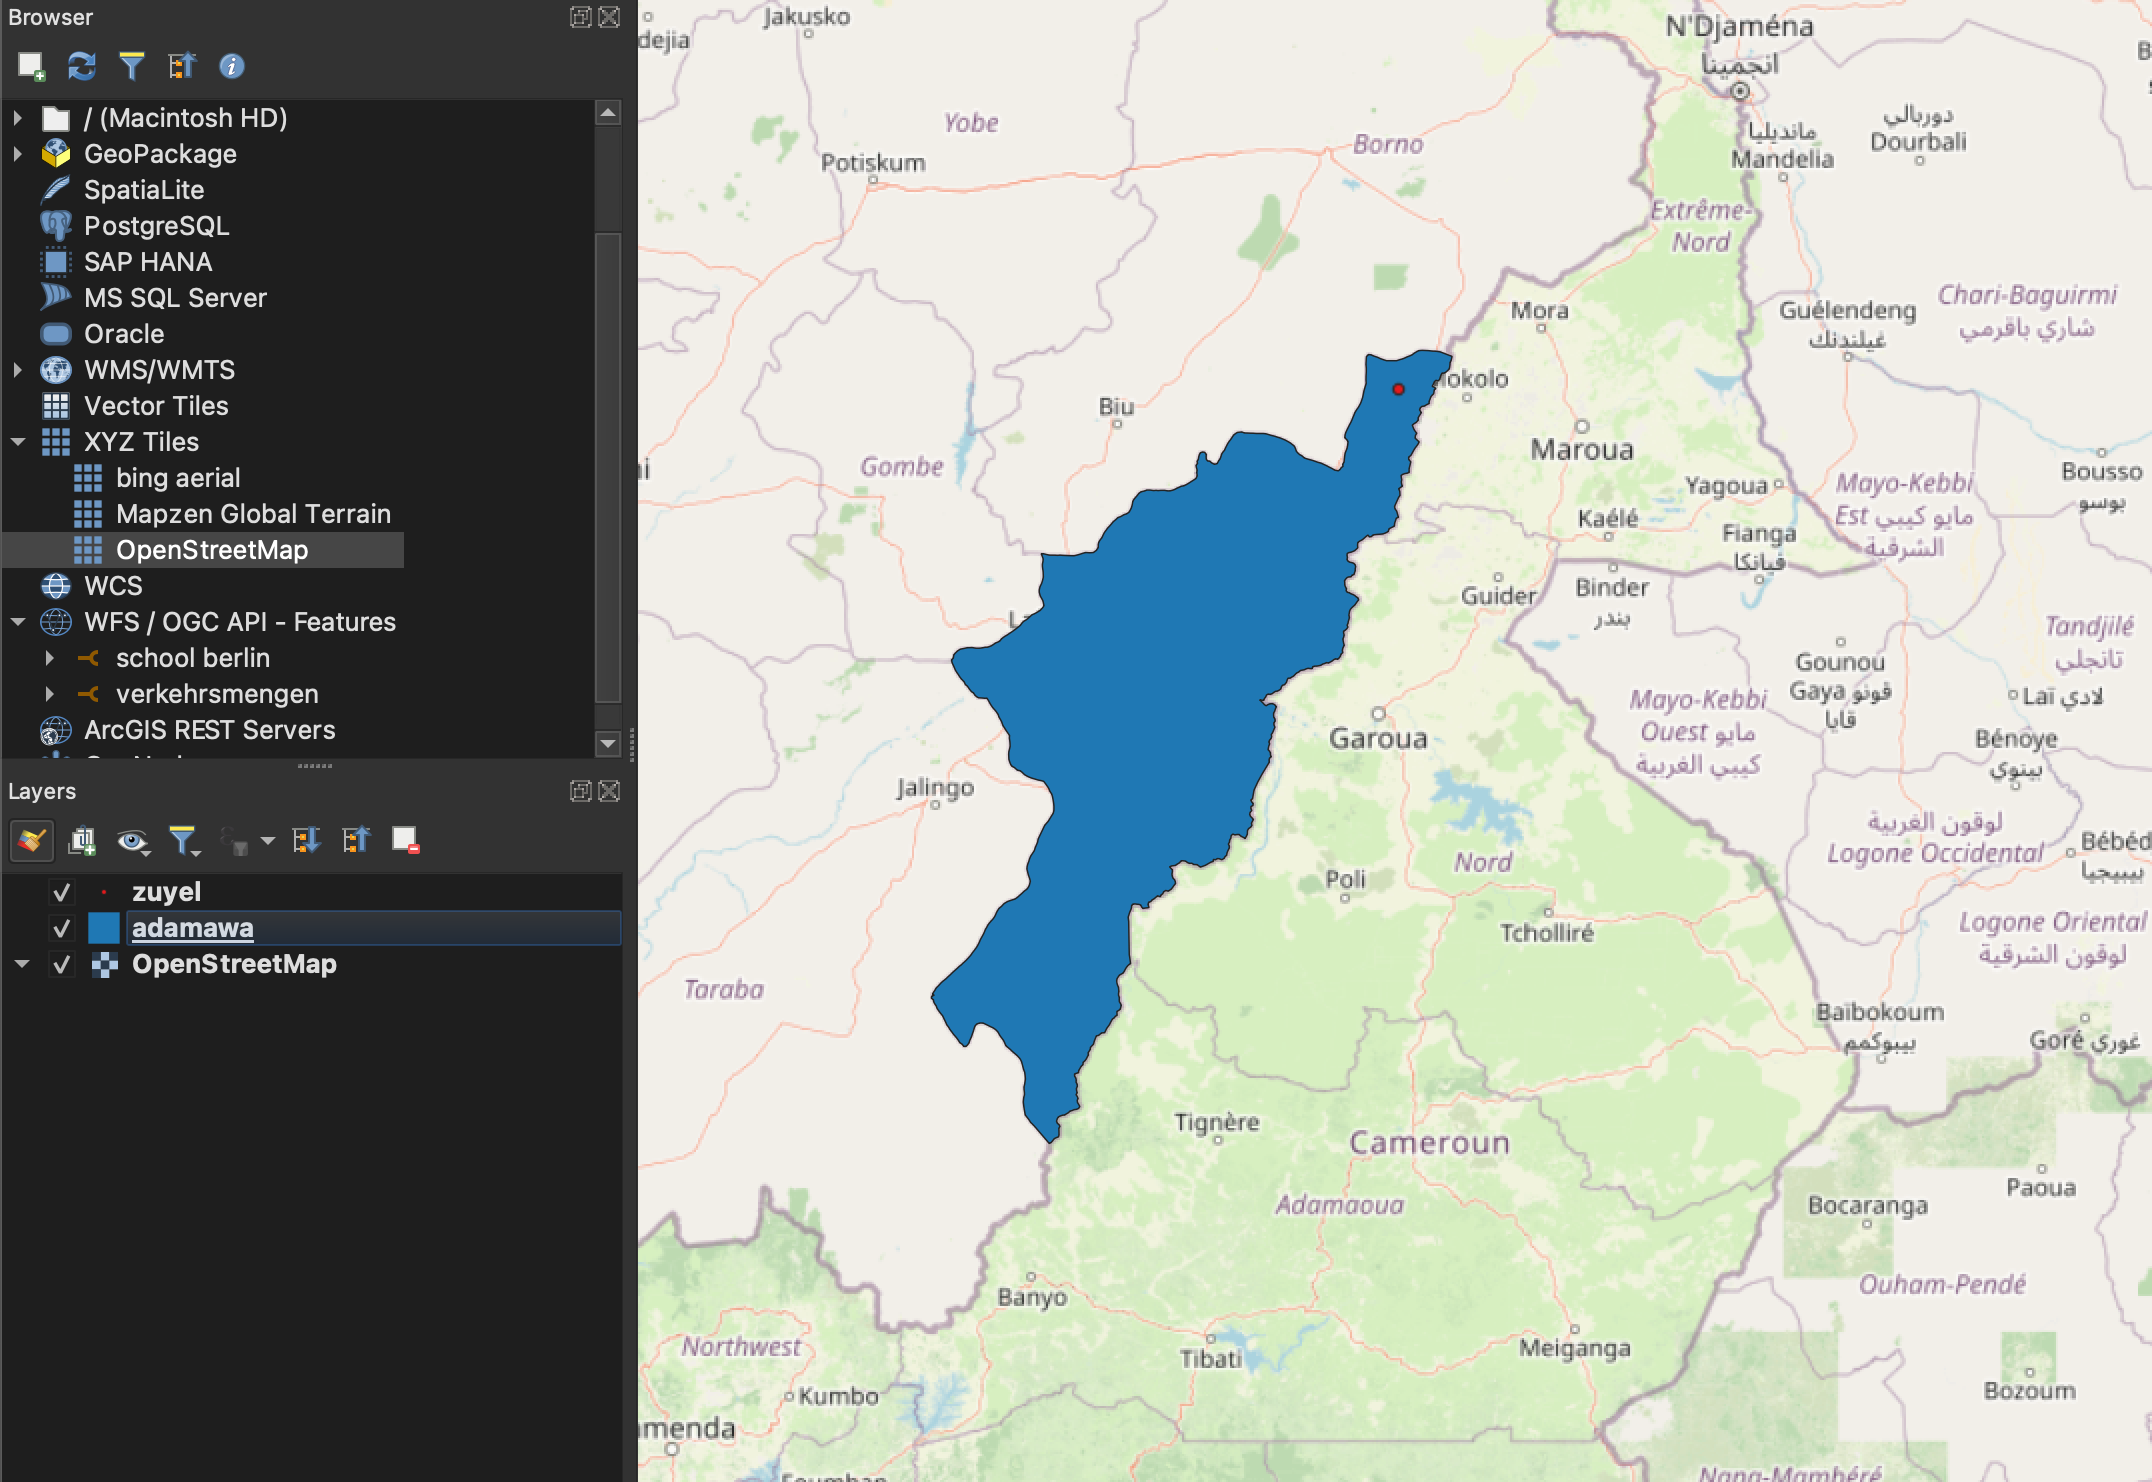
This is how your output could look like in the end#