Sketch Map Tool Exercise 4 - Basic Visualization of the results in QGIS & uMAP #
Characteristics of the exercise #
Although all data and assumptions are fictional, they were created in the context of a real flood event described in a news article.
Aim of this exercise:
Type of trainings exercise:
This exercise can be used in online and presence training and is focused on an hands-on experience with the basic of QGIS or UMAP.
Focus group (GIS-Knowlege Level)
Exercise builds on prior-knowledge of Sketch Map Tool. Make sure Exercise 1 has been done before or knowledge on the background on Sketch Map Tool is there.
GIS Beginners-level: no specific knowledge about QGIS/uMAP required
Phase of participatory/community mapping
Analysing participatory mapping
Available Data
Download the data for this exercise here and unzip the folder
In the data subfolder (
\data\input), you will find the data you need to start the exercise (created raw map & pre-marked and photographed map). You will also find de geodata of the results (\data\output) and the intermediate result(\data\temp).
Tip
Decide together with the responsible working group which GIS system is preferred and decide on one. There is no necessity to learn and use both ways. Generally QGIS will give you more opportunities for visualisation and analysis of the results. If a simple and quick visualization without installation of software packages is desired, UMAP might be an easy solution.
Instructions for the trainers #
Trainers Corner
Prepare the training
Online access and devices (PC)
QGIS installed on the computer
Take a look and make yourself familiar on the provided material for the exercise and the Sketch Map Tool in general.
Check out How to do trainings? for some general tips on training conduction
Note
If you like to skip parts of the workflow, you can use the available geodata or intermediate results.
If you would like to adapt this exercise to your specific use case, create your own case-description.
Conduct the training:
Introduction:
Introduce the idea, the aim and the general workflow of the Sketch Map Tool beforehand
Provide access to the needed material
check-in if there are questions or problems.
Wrap up:
Take some time at the end to wrap up and that several people present their result map
Discuss Benefits of showing results as a map
Time to for Open questions.
Step-by step introduction for participants #
You can choose whether you want to do the exercise with QGIS (Exercise A) or with uMAP (Exercise B) (or both). An internet connection is required to work with uMAP.
Click here to start exercise A (QGIS)
Click here to start exercise B (uMAP)
If you experience any problems during your use of the Sketch Map Tool, please take a look at the Help page.
Exercise A: Exploration & basic visualization of Sketch Map Tool outputs in QGIS #
Exercise A: Exploration & basic visualization of Sketch Map Tool outputs in QGIS
1. Scenario and Background
Map the flood extent, potential emergency shelters and potential hazardous substances in a fictional flooding scenario in Kumasi using Sketch Maps.
1. Data Collection
Please download the prepared maps here.
Unzip the .zip folder in order and navigate to data\Input\marked_sketch_maps.
Optional: You find the empty map in the data input folder: \Sketch_Map_Tool_Exercise_4\data\input\empty_sketch_map. Feel free to draw some additional flood maps by printing the template out and drawing on it or by using a simple graphics editor.
2. Geo-referencing and auto-extraction with the Sketch Map tool
Upload the marked sketch maps back to the tool’s website ( already marked sketch maps: \Sketch_Map_Tool_Exercise_4\data\input\marked_sketch_maps). Head to sketch-map-tool.heigit.org and choose ‘Digitize your Sketch maps’ on the right. Upload all your sketches in .png or .jpg format. You can mark your sketches and simply drag and drop them into the window.
The sketch maps are now being processed and georeferenced with the annotations extracted and vectorized. Download the vectors. You may use the ones we have prepared in the input data folder: \Sketch_Map_Tool_Exercise_4\data\output\Kumasi_SMT_Ex4.geojson.
3. Start your QGIS Project
Open QGIS and navigate to Project -> New and click on Save. Navigate to where you want to save your project, give it a name and click Save again. When working in QGIS always remember to save your project every now and then.
Now load your vector file (“Kumasi_SMT_Ex4.geojson”) and geotiff files (“Kumasi_sketch-map_Ex4_1.geotiff”) by dragging and dropping them into the layer panel.
3. Explore the data
Orientate in the User Interface
If you are a beginner to QGIS get to know the basics of the QGIS User Interface here.
Add a Basemap
For a better overview and orientation it is always helpful to add a basemap to your project and put your situation in a spatial context. Find in the
BrowserPanelXYZ Tiles, open the dropdown by clicking on it and select OpenStreetMap or another basemap.Click here for more information on basemaps and how to add them to your project.
Understand the Layer Concept
By dragging and dropping your data into QGIS the data will be visualized in the map canvas and its description will be visible in the
LayersPanel. You should now have 7 layers in your panel: your geojson output (vector), your 5 geotiffs (Raster) and the OpenStreetMap basemap. In order to see all the information you have to bing them into order. It is important to understand the Layer Concept.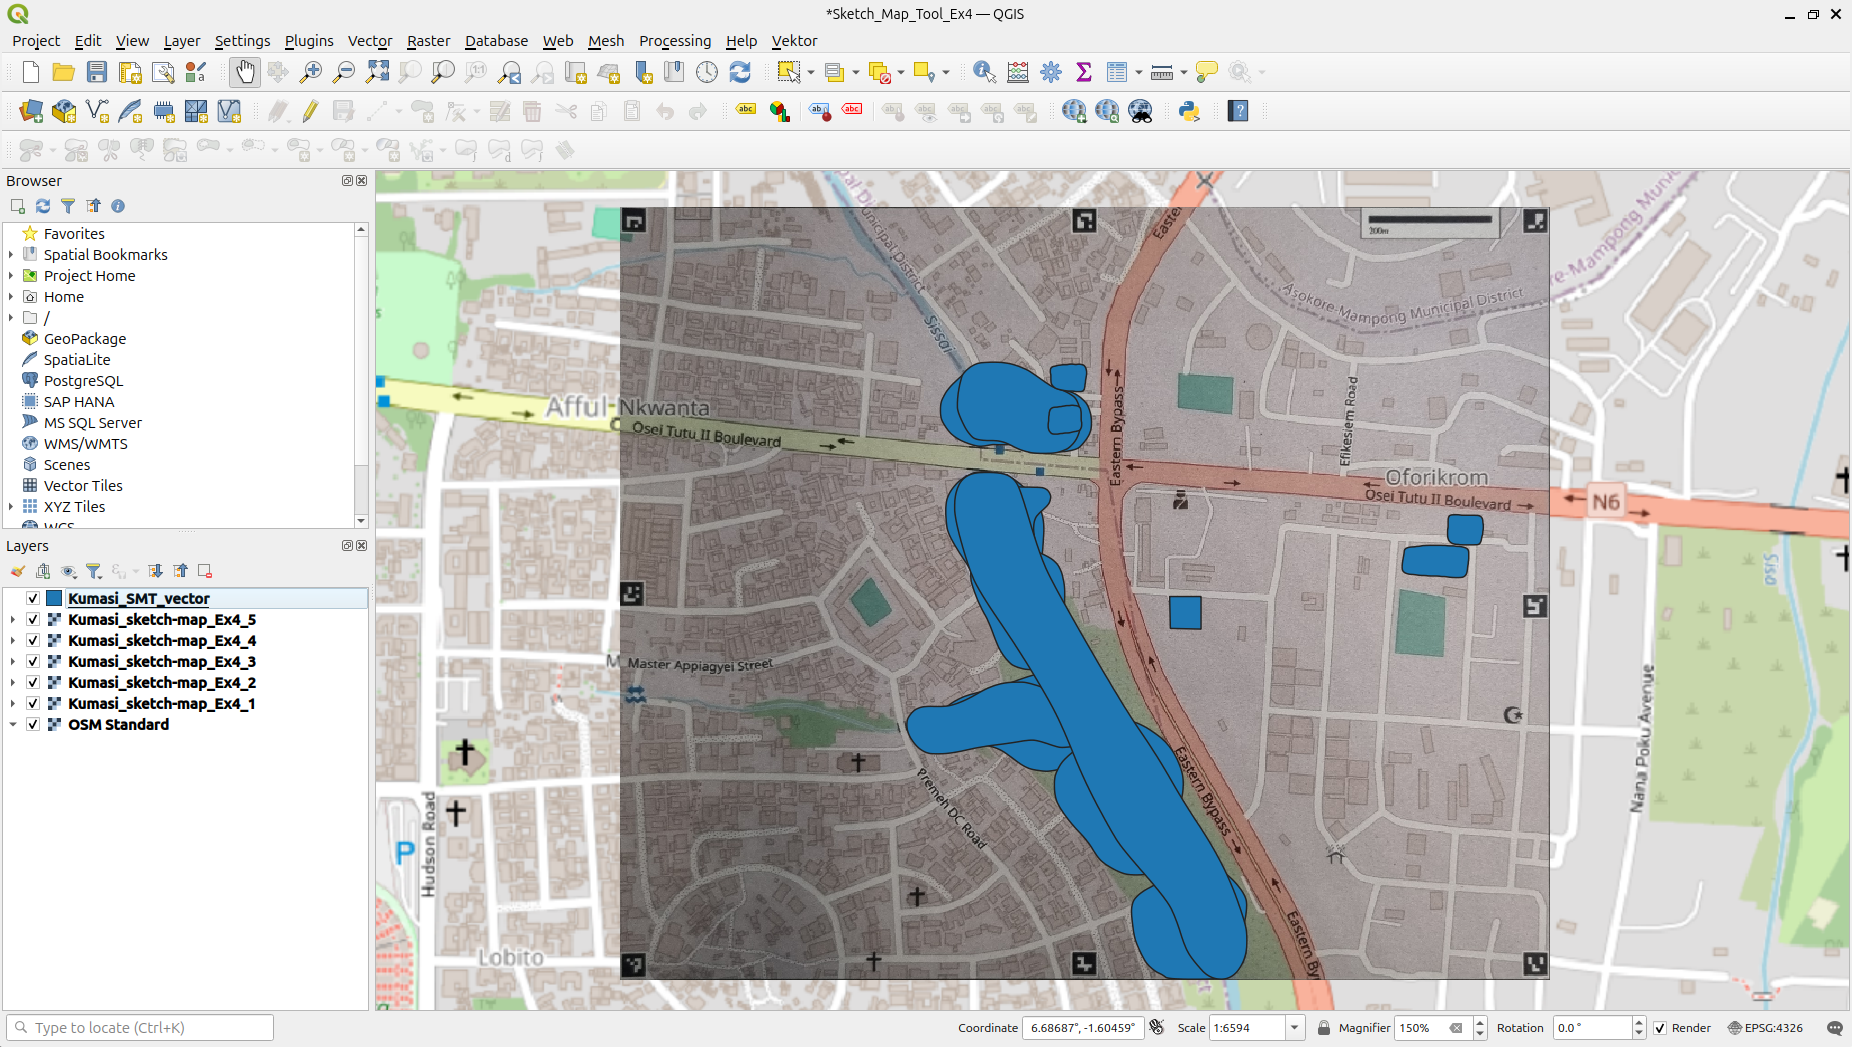
Fig. 154 The QGIS interface with the data loaded into the QGIS-project#
Explore the data
Vector data
In order to explore your detected markings, right-click on your vector file and navigate to
Open Attribute Tableand click on it. The table has one entry (row) for each detected marking. In our example, 13 markings where detected. The column “color” describes the color which has been detected for each marking and the column “name” contains the name of your uploaded Sketch Map.Note
When you upload several marked Sketch Maps simultaneously, you will get one vector output containing all the markings of all Sketch Maps. In this case the column “name” helps you to track on which map each marking was detected.
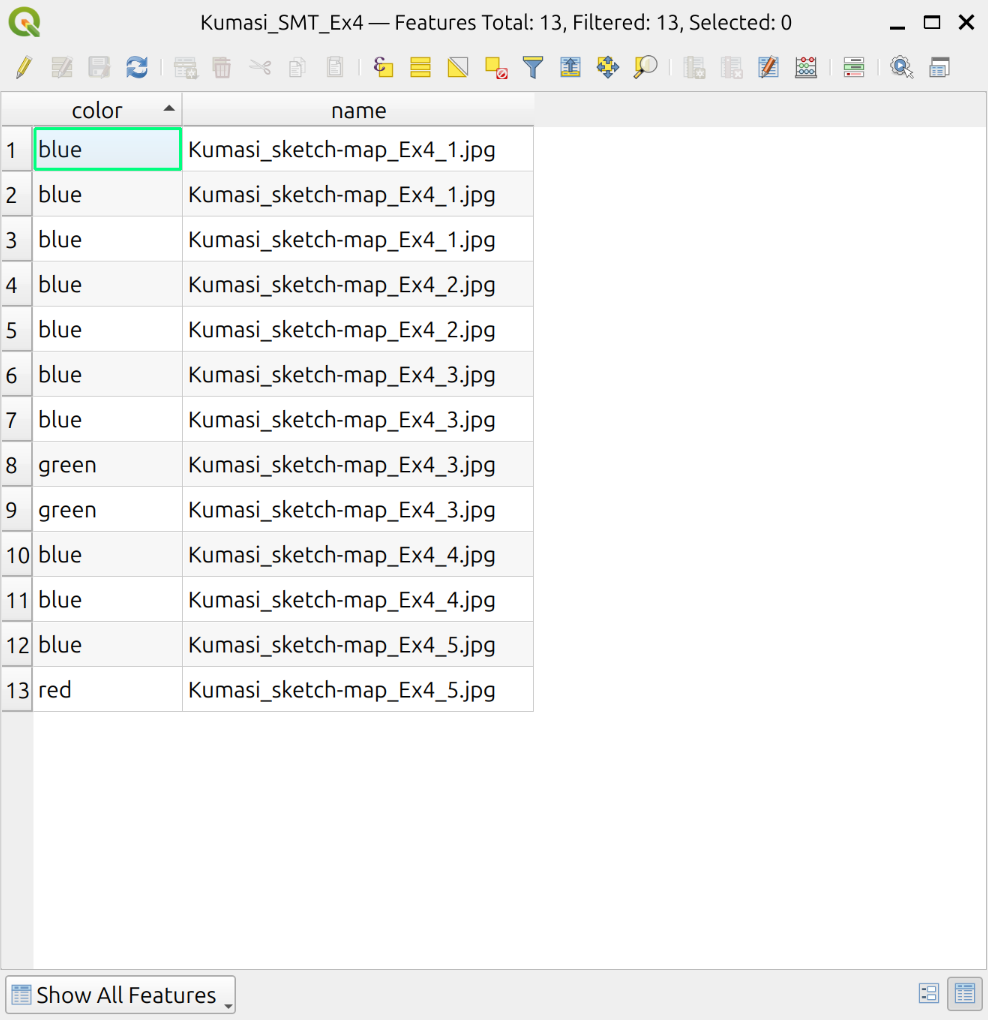
Fig. 155 Attribute table of the vector file output of Sketch Map Tool#
GeoTIFF
The Raster file as result of the Sketch Map Tool is the photo you took of your Sketch Map, but georeferenced. You see if the georeferencing is correct when it matches the base map. Furthermore your
.tiff-file is helpful to compare and review the marking detection (vector file). In this case your tiff is your “ground truth” and you can check if the marking detection by the tool is true or if there are pieces missing or wrongly detected.Question: Do your different output match or do you find any errors?
-> Yes, you are right. Unfortunately, one marked polygon did not get detected. This can happen since markings are being detected by machine learning algorithms that can encounter problems in some situations.
5. Correct or enhance your data
1. Digitization: Add a marking manually
So what can we do if a marking has not been detected? We can add missing markings manually by tracking the drawing on the geotiff file. This process is also called digitisation.
Right-click on your vector file and click on Toggle Editing. The Digitizing Toolbox in your menu bar on top of your QGIS will be activated:

Fig. 156 Digitsing Toolbox in QGIS 3.36#
Click on Add Feature: Capture Polygon . You will note that your mouse pointer now changed its symbol into a target. This means you can now start tracing the missing polygon my left-clicking. You finish your polygon by a right-click and you will be asked to enter the descriptions. Enter the information and click ok.
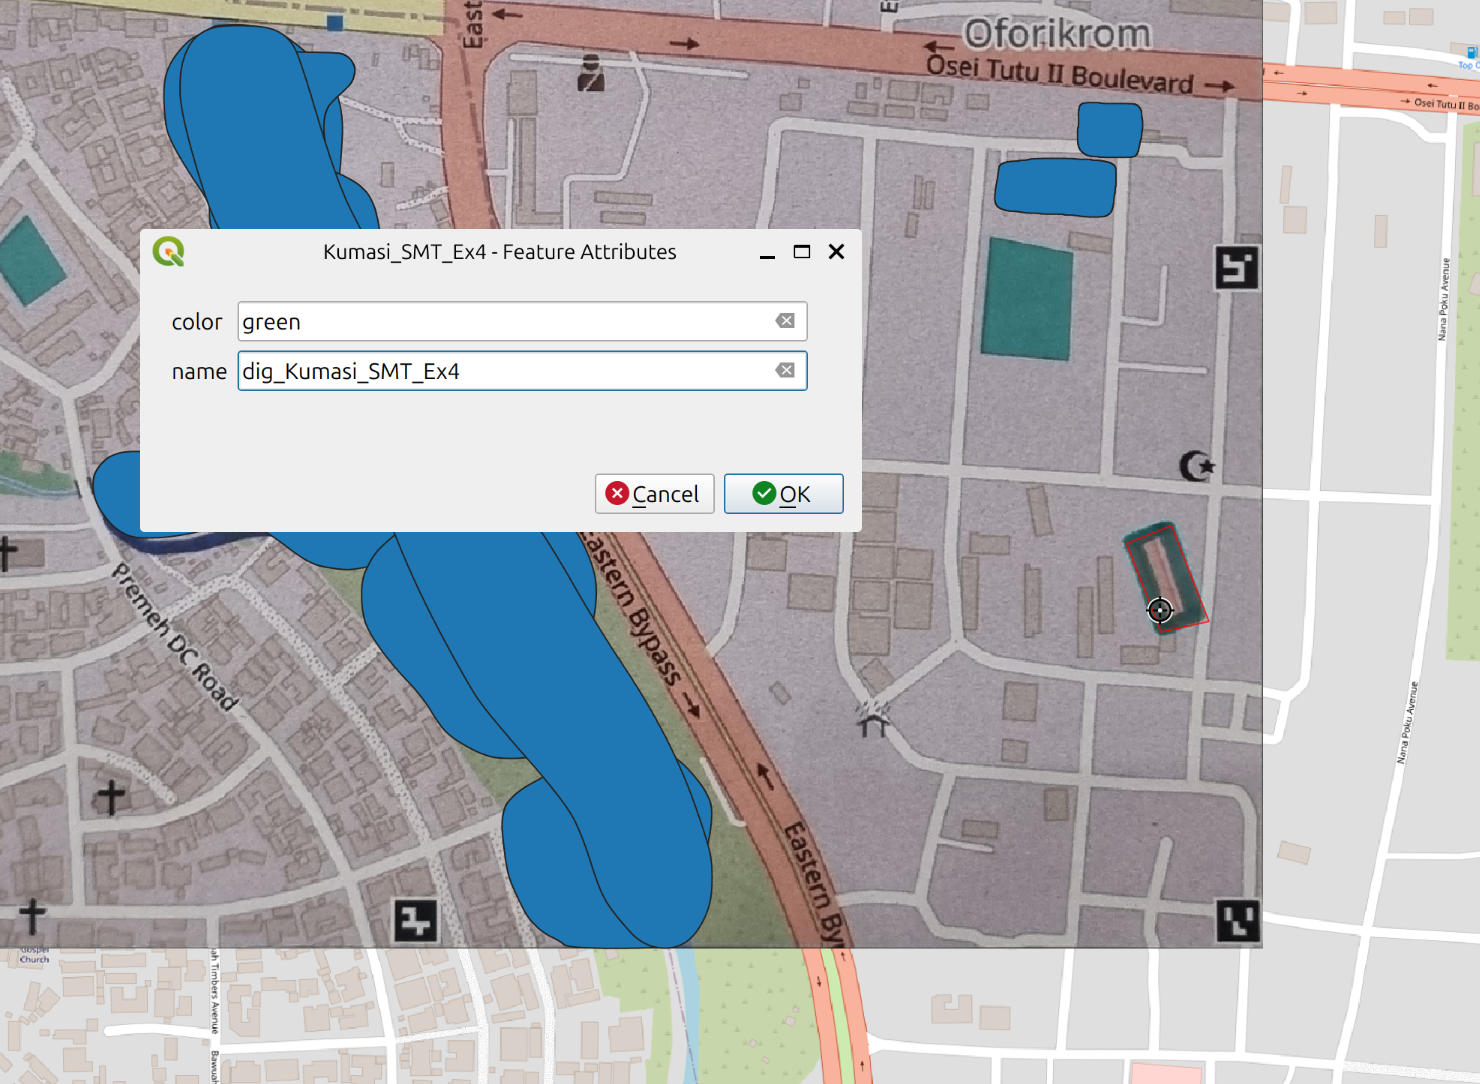
Fig. 157 Digitizing#
In the map canvas you can already see your hand-drawn polygon. In order to save it, you should now right-click on your vector layer and turn off the Editing mode by clicking on Toggle Editing -> Save. Check your result by looking at the Attribute Table again: You now have 14 features in your table.
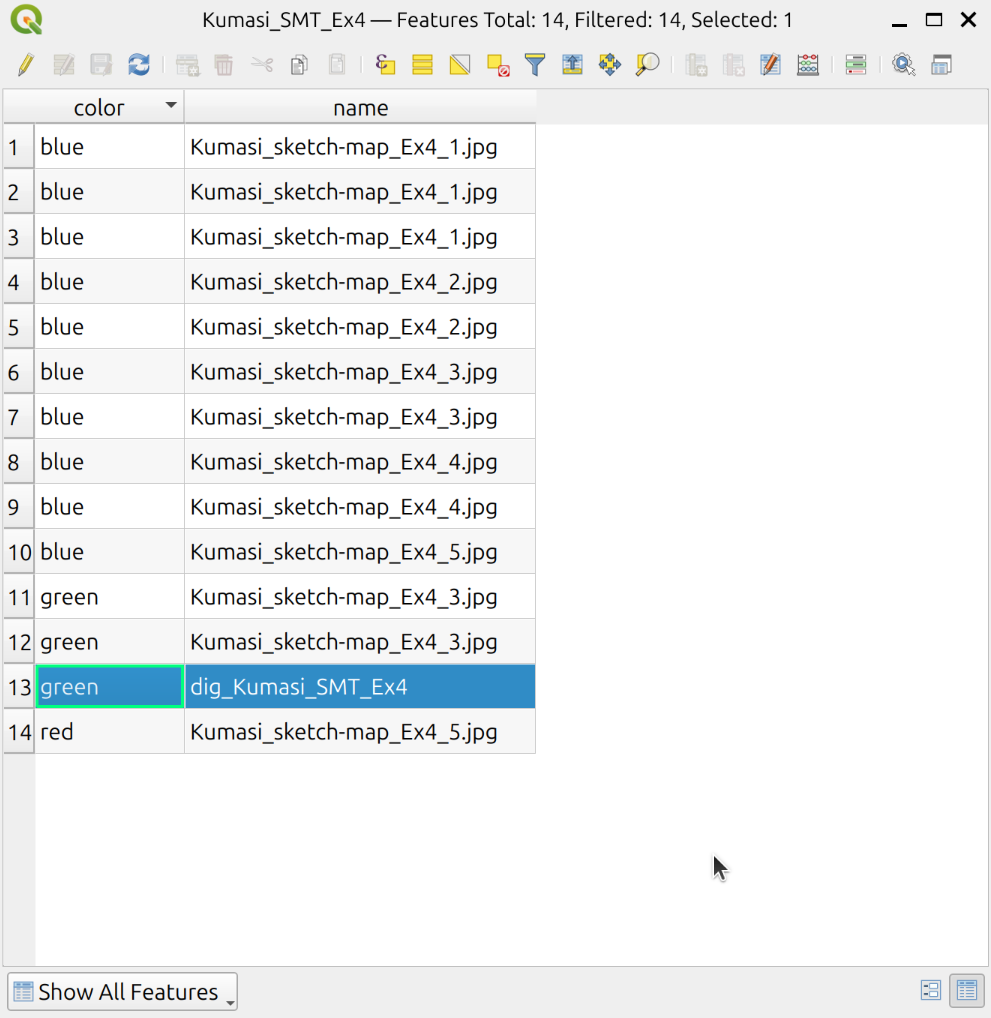
Fig. 158 Attribute Table with added polygon#
The whole process of Digitization is explained in detail here.
2. Add a property/column to the Attribute Table
Normally, you know the meaning of the markings in your Sketch Map. We will now learn how to add them to your vector layer. In our example, we assume we know that blue were used to mark flood extents, red was used to mark potential hazardous substances and green to mark potential emergency shelters. We want to replicate this:
Right-click on your vector layer, navigate to
Open Attribute Tableand click on it.In the upper left corner click on
 to toggle editing mode
click on
 to add a new field to the data source
As
Nameenter “Description”, choose “Text (String)”Type, asLengthenter “20” and clickOK
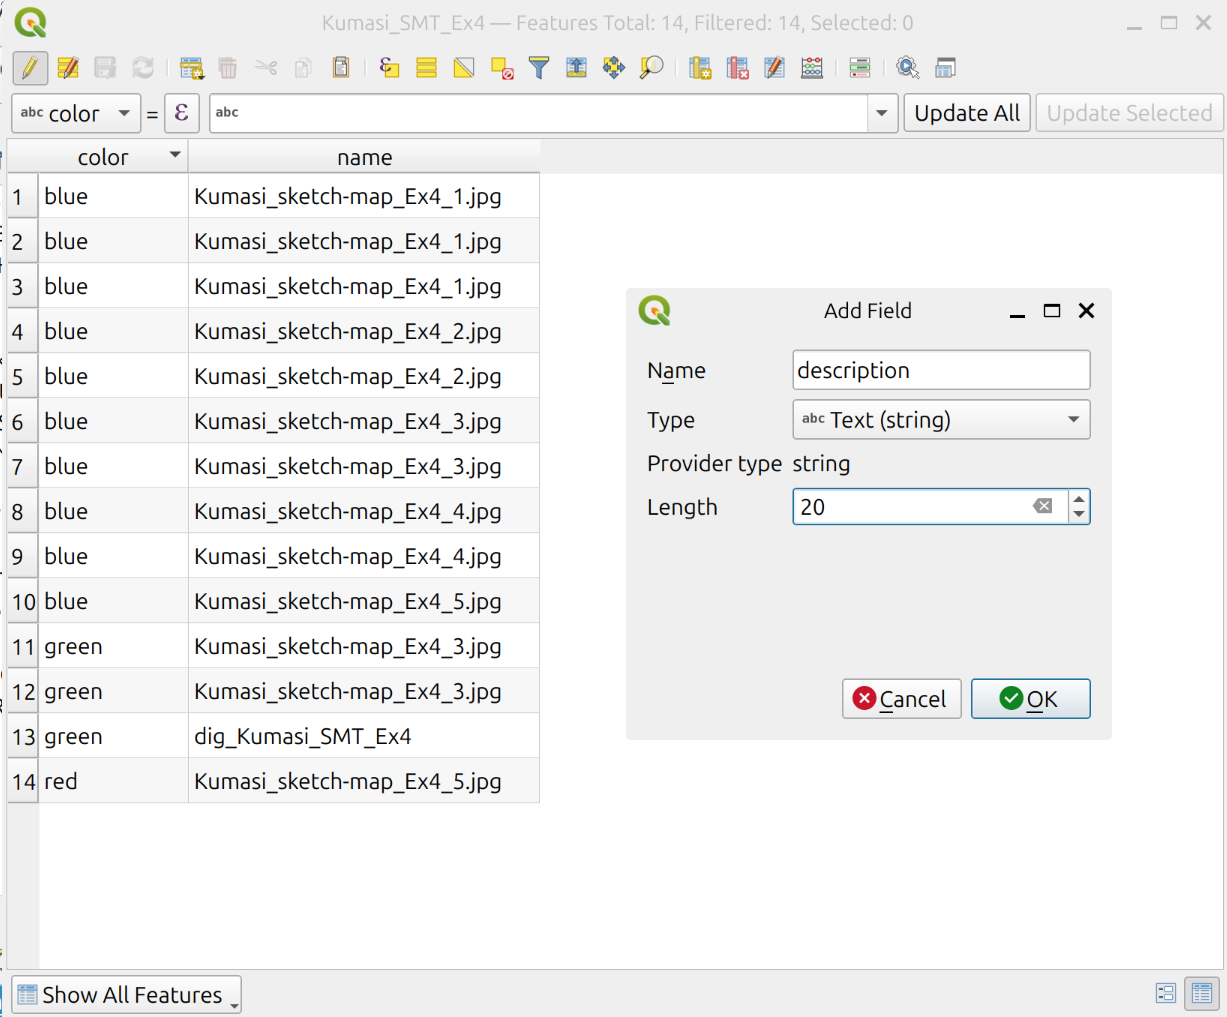
Fig. 159 Adding a new field to the attribute table#
by clicking on each field you can now enter the respective descriptions to the colors:
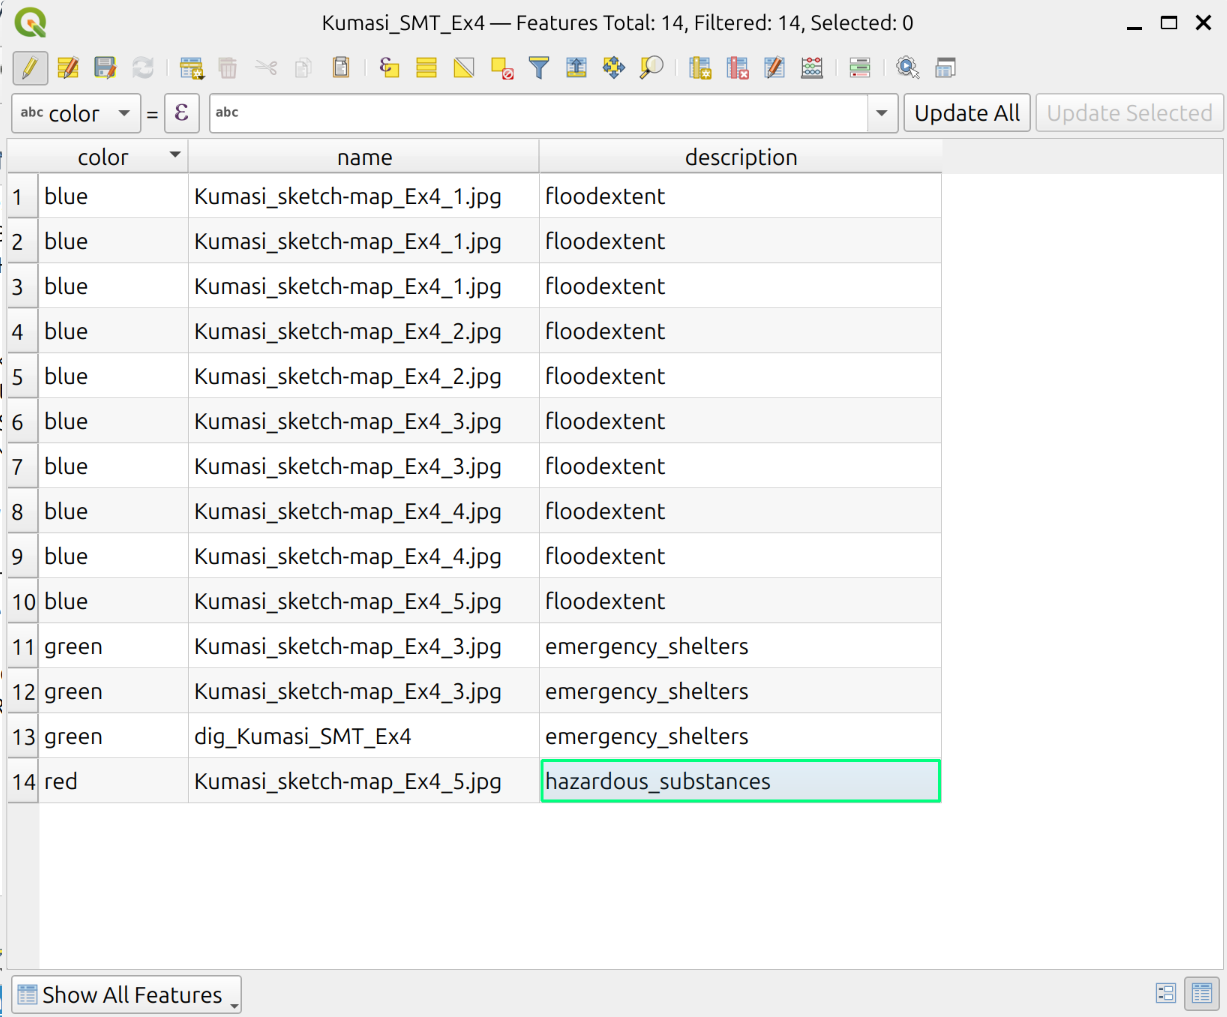
Fig. 160 Adding descriptions to the fields#
Make sure that you don’t have any typos in the description
Save by clicking on
once more -> Save
6. Visualize your data
Now we want to visualize our results and generate a printable map so the results can be shown to third parties in a clear and comprehensible manner. We can now delete the geotiff layer by right-click -> Remove Layer since we will be working with the vector marking detections.
1. Customize Symbology
We can customize the symbology of our vector layer by right-clicking on it in the Layers Panel -> Properties -> Symbology.
First of all we want to assign different colors for different features:
In the topmost drop-down menu, choose Categorized. As Value choose “Description” and then click on the bottom left on Classify. We are now able to choose colors depending on the value in the column “Description”. By double-clicking on the colored box in your window next to your value and Legend descriptions the Symbol Selector will open in a new window where you can choose the color of your preference by clicking on the drop-down arrow next to “Color”.
Right below you can also adjust the opacity level of your feature.
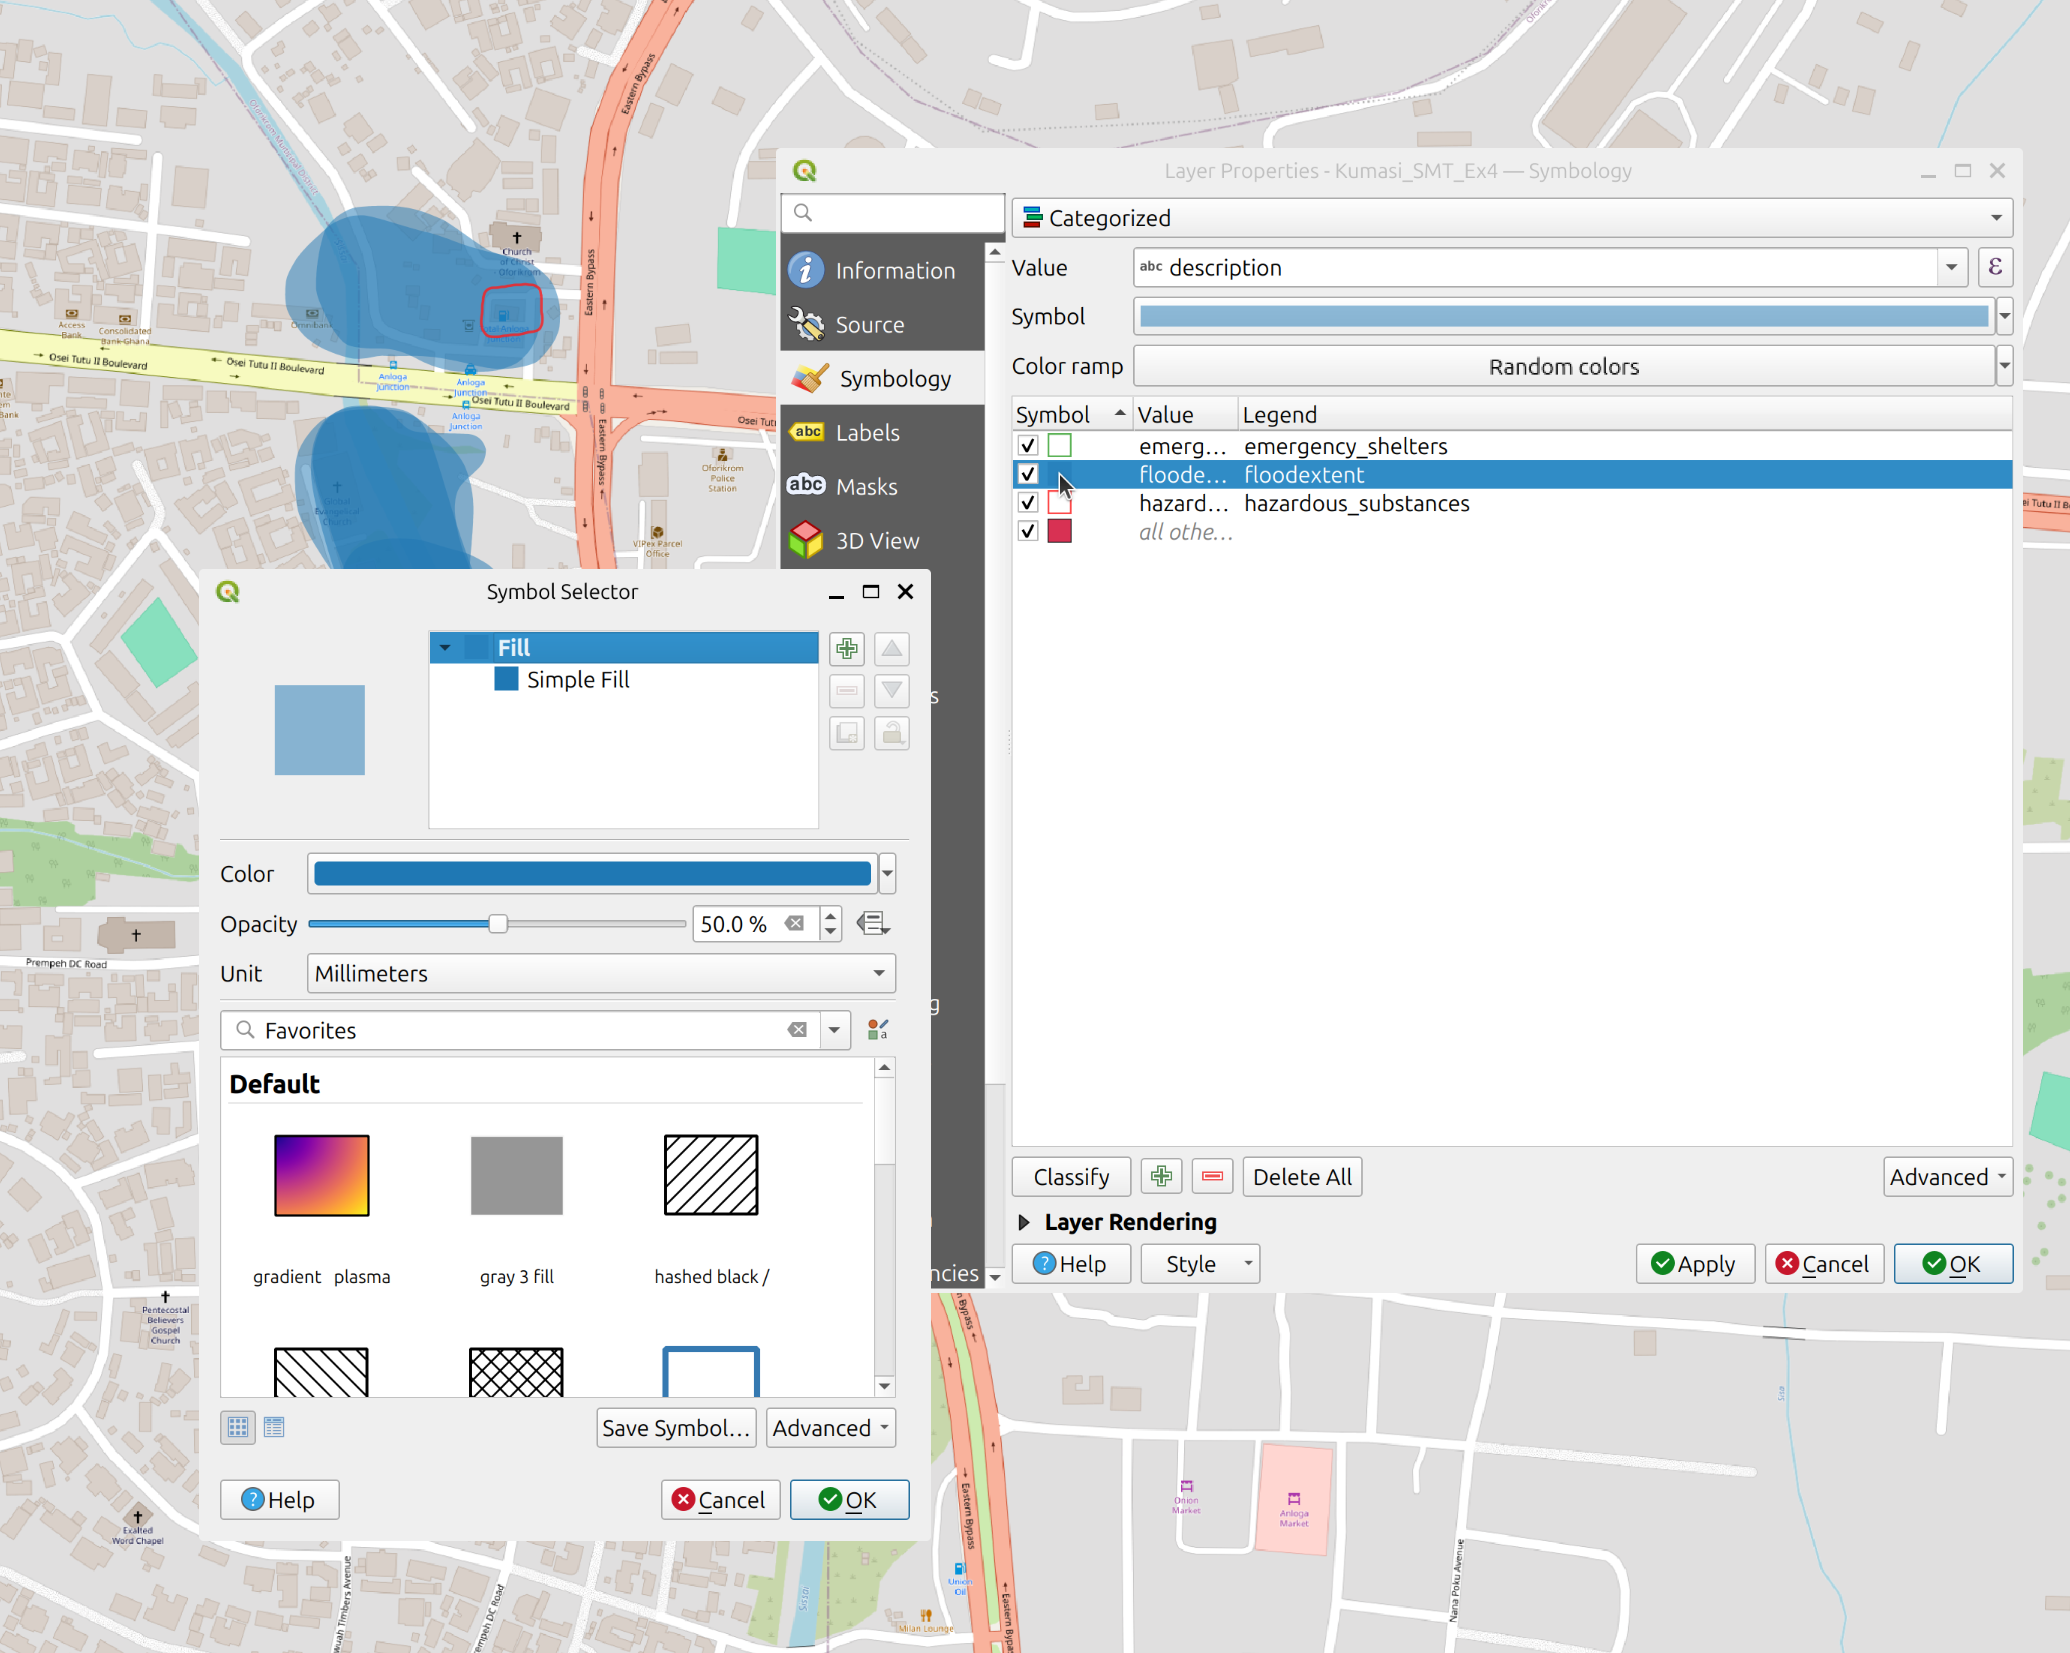
Fig. 161 Adjusting the symbology with the symbology tab#
In the Symbol Selector, you can also click on Simple line in the upper window and change the Symbol Layer Type. In this example, we would like to symbolize the potential hazardous substances with red outlines, so we choose “Outline: Simple Line”. Just below we can adjust the color, stroke width, stroke line type, etc. You can find more information about the visualization of vector data here.
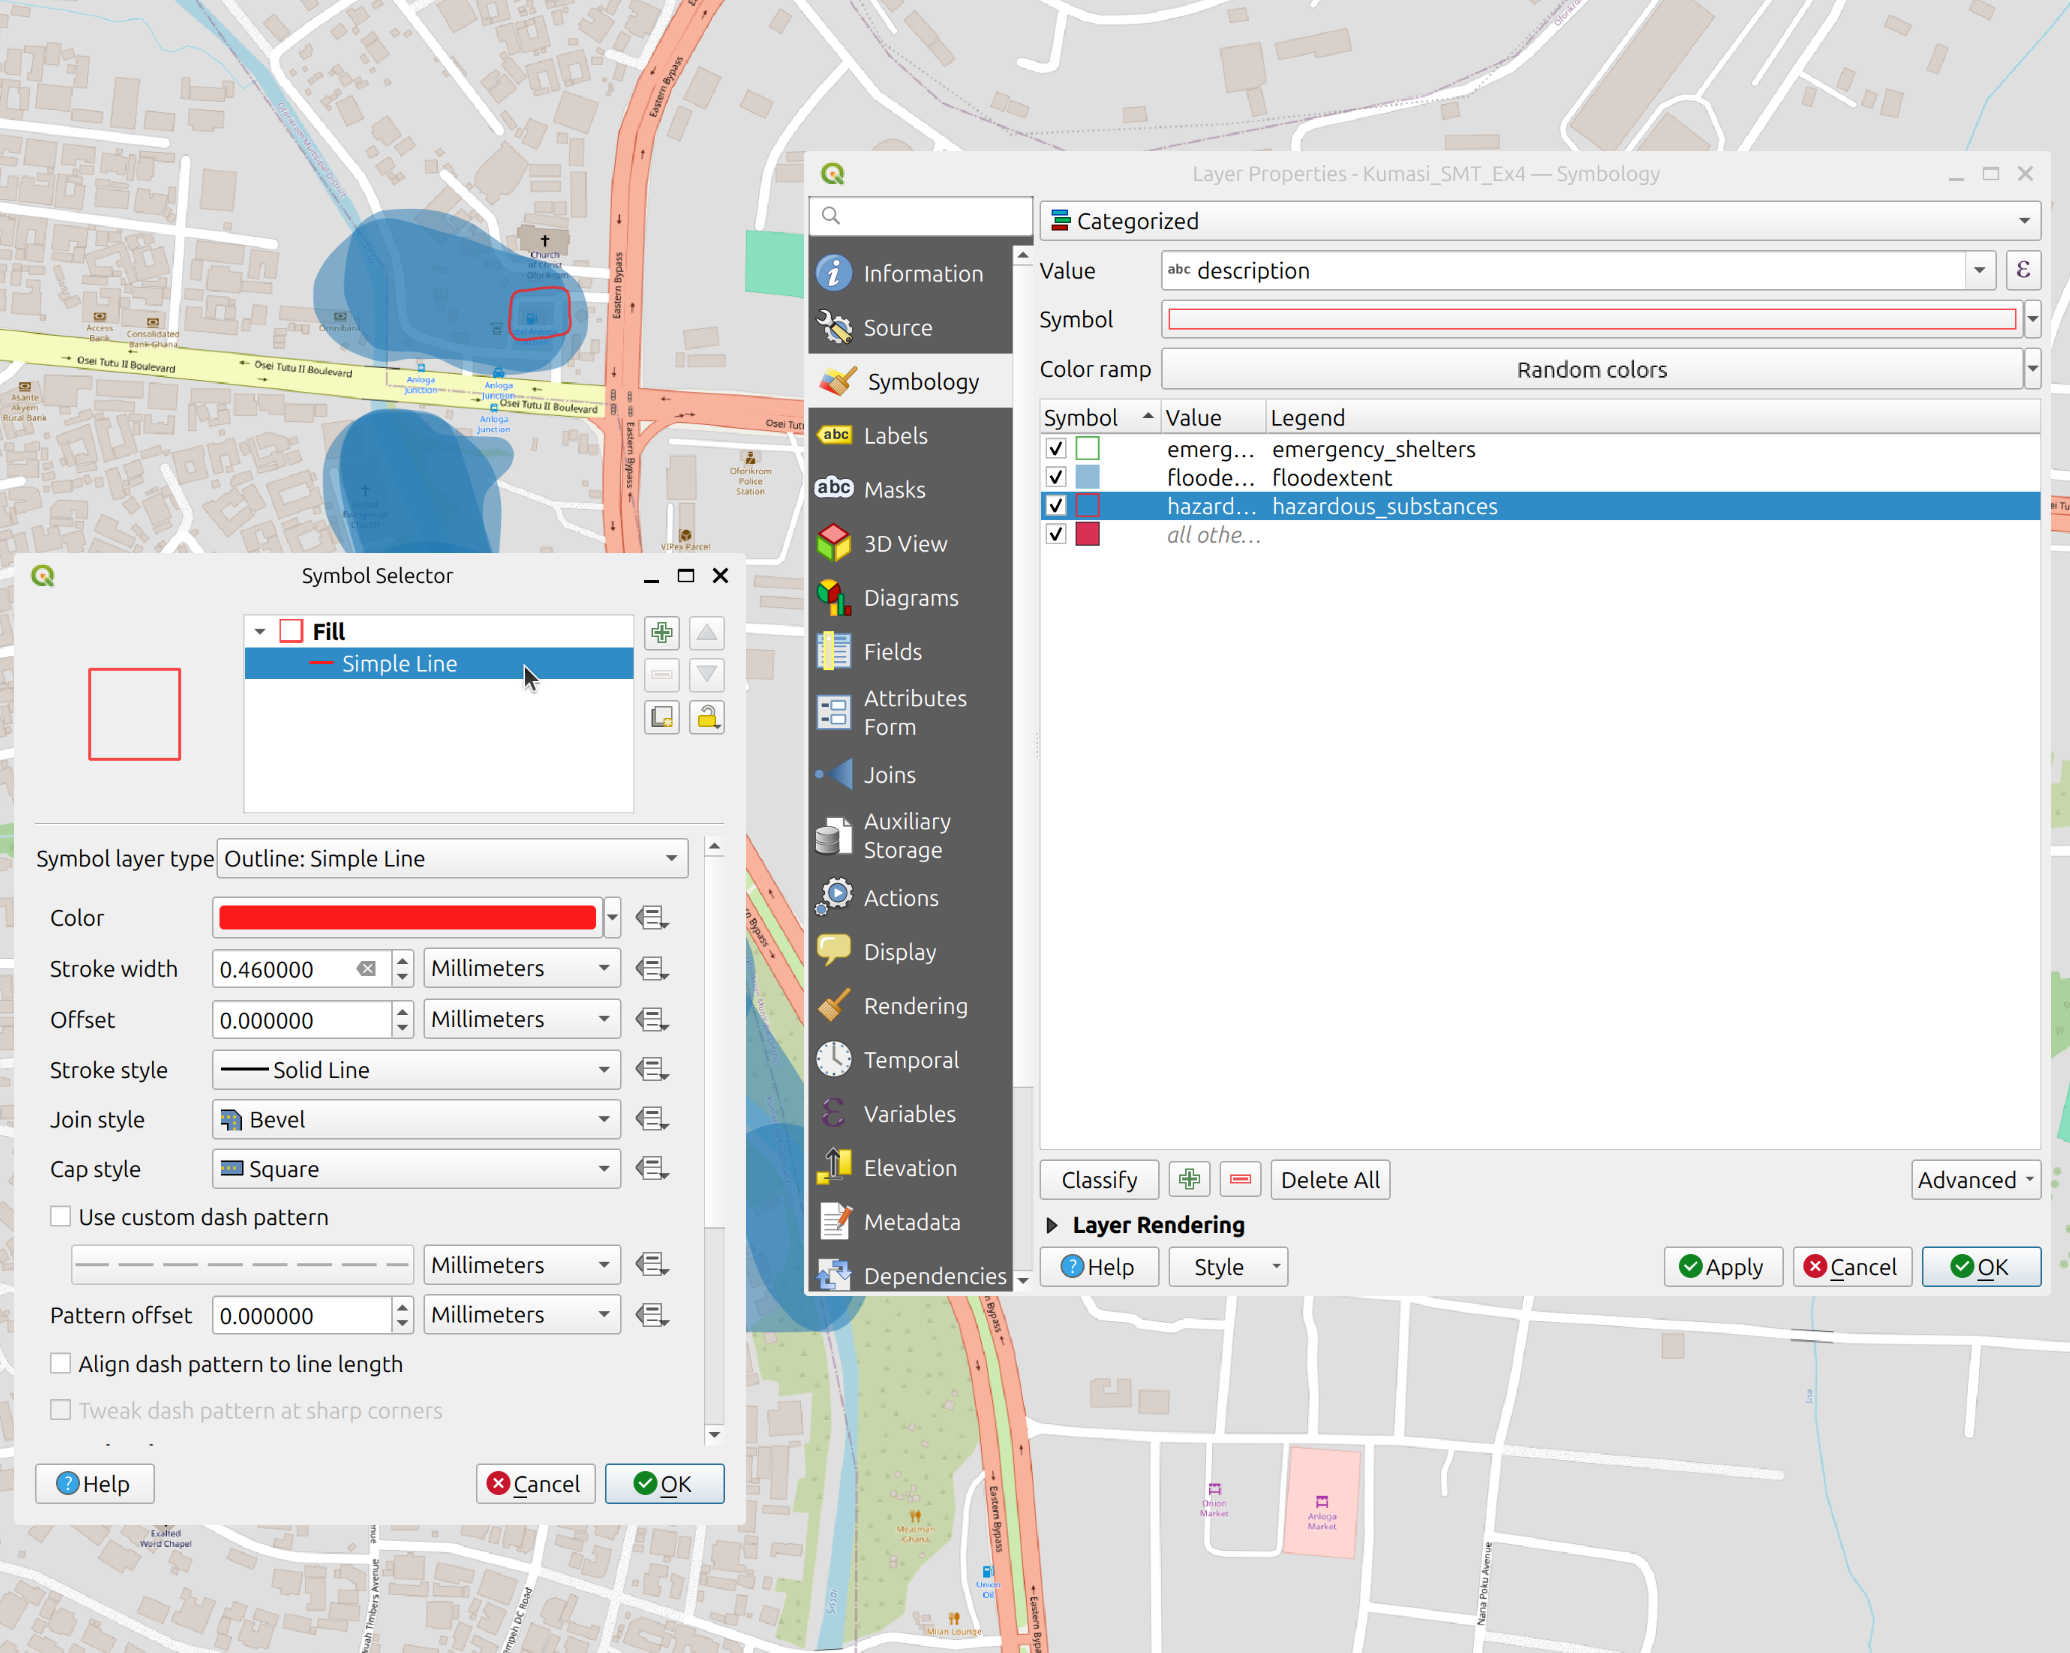
Fig. 162 Using the symbol selector#
2. Make a printable Map
Open a new print layout by clicking on
Project->New Print Layout-> enter the name of your current Project e.g “Kumasi Flooding Sketch Map Tool”. A new window will open with a blank canvas and a different set of tools. This is the print layout designer.
Insert a new map by clicking on the
 (“Add Map”) on the left toolbar, and drawing a rectangle on the print canvas. Video
Move and position the map so that the entire country is visible at a reasonable scale.
Let’s add a title:
Click on the
 (
(Add text)Drag a rectangle on the canvas
In the items properties window on the right, you will find a text box with the text “Lorem ipsum”. Here you can enter your map title (e.g.: Flood Extent, Potential Emergency Shelters and Potential Hazardous Substances in Kumasi, Ghana (fictional)).
Adjust the font size: Click on the Font dropdown menu and adjust the font size for a title (25p or more). Adjust the text box if necessary.
Let’s add a legend:
Click on the
 (
(Add legend).Navigate to the Item Properties panel on the right.
Scroll down a bit and check turn off
Auto Updateby unchecking the check box. Now you can freely edit every item on the legendAdjust the legend by removing unnecessary layers (which are not seen on the map) and rename the layer in the legend by clicking on
 (
(Edit selected item properties) below the legend entries.
Now, let’s add a scale bar:
Click on the
 (
(Add Scale bar)Draw a rectangle on the map and position the scale bar on the edge of the map. You can adjust the scale bar units (meters, kilometers, …), the fixed segment width (50 km, 75 km, 100 km, …) and the number of segments (to the right).
Let’s add North arrow:
Click on the
 (
(Add North Arrow).Drag a rectangle on the print layout. Adjust the size and location of the north arrow. You can also change the icon in the item properties.
Add a text box with additional information, sources, the author (you), and date of creation.
When you are happy with your print layout. You can export it as a PDF. You can save it in the project folder under “results”.
Once you have exported the map. Look at the PDF and make sure it looks how you intended. Some things might look different in the PDF. If it does not look correct you may need to make some adjustments in the symbology.
The finished map could look something like this:
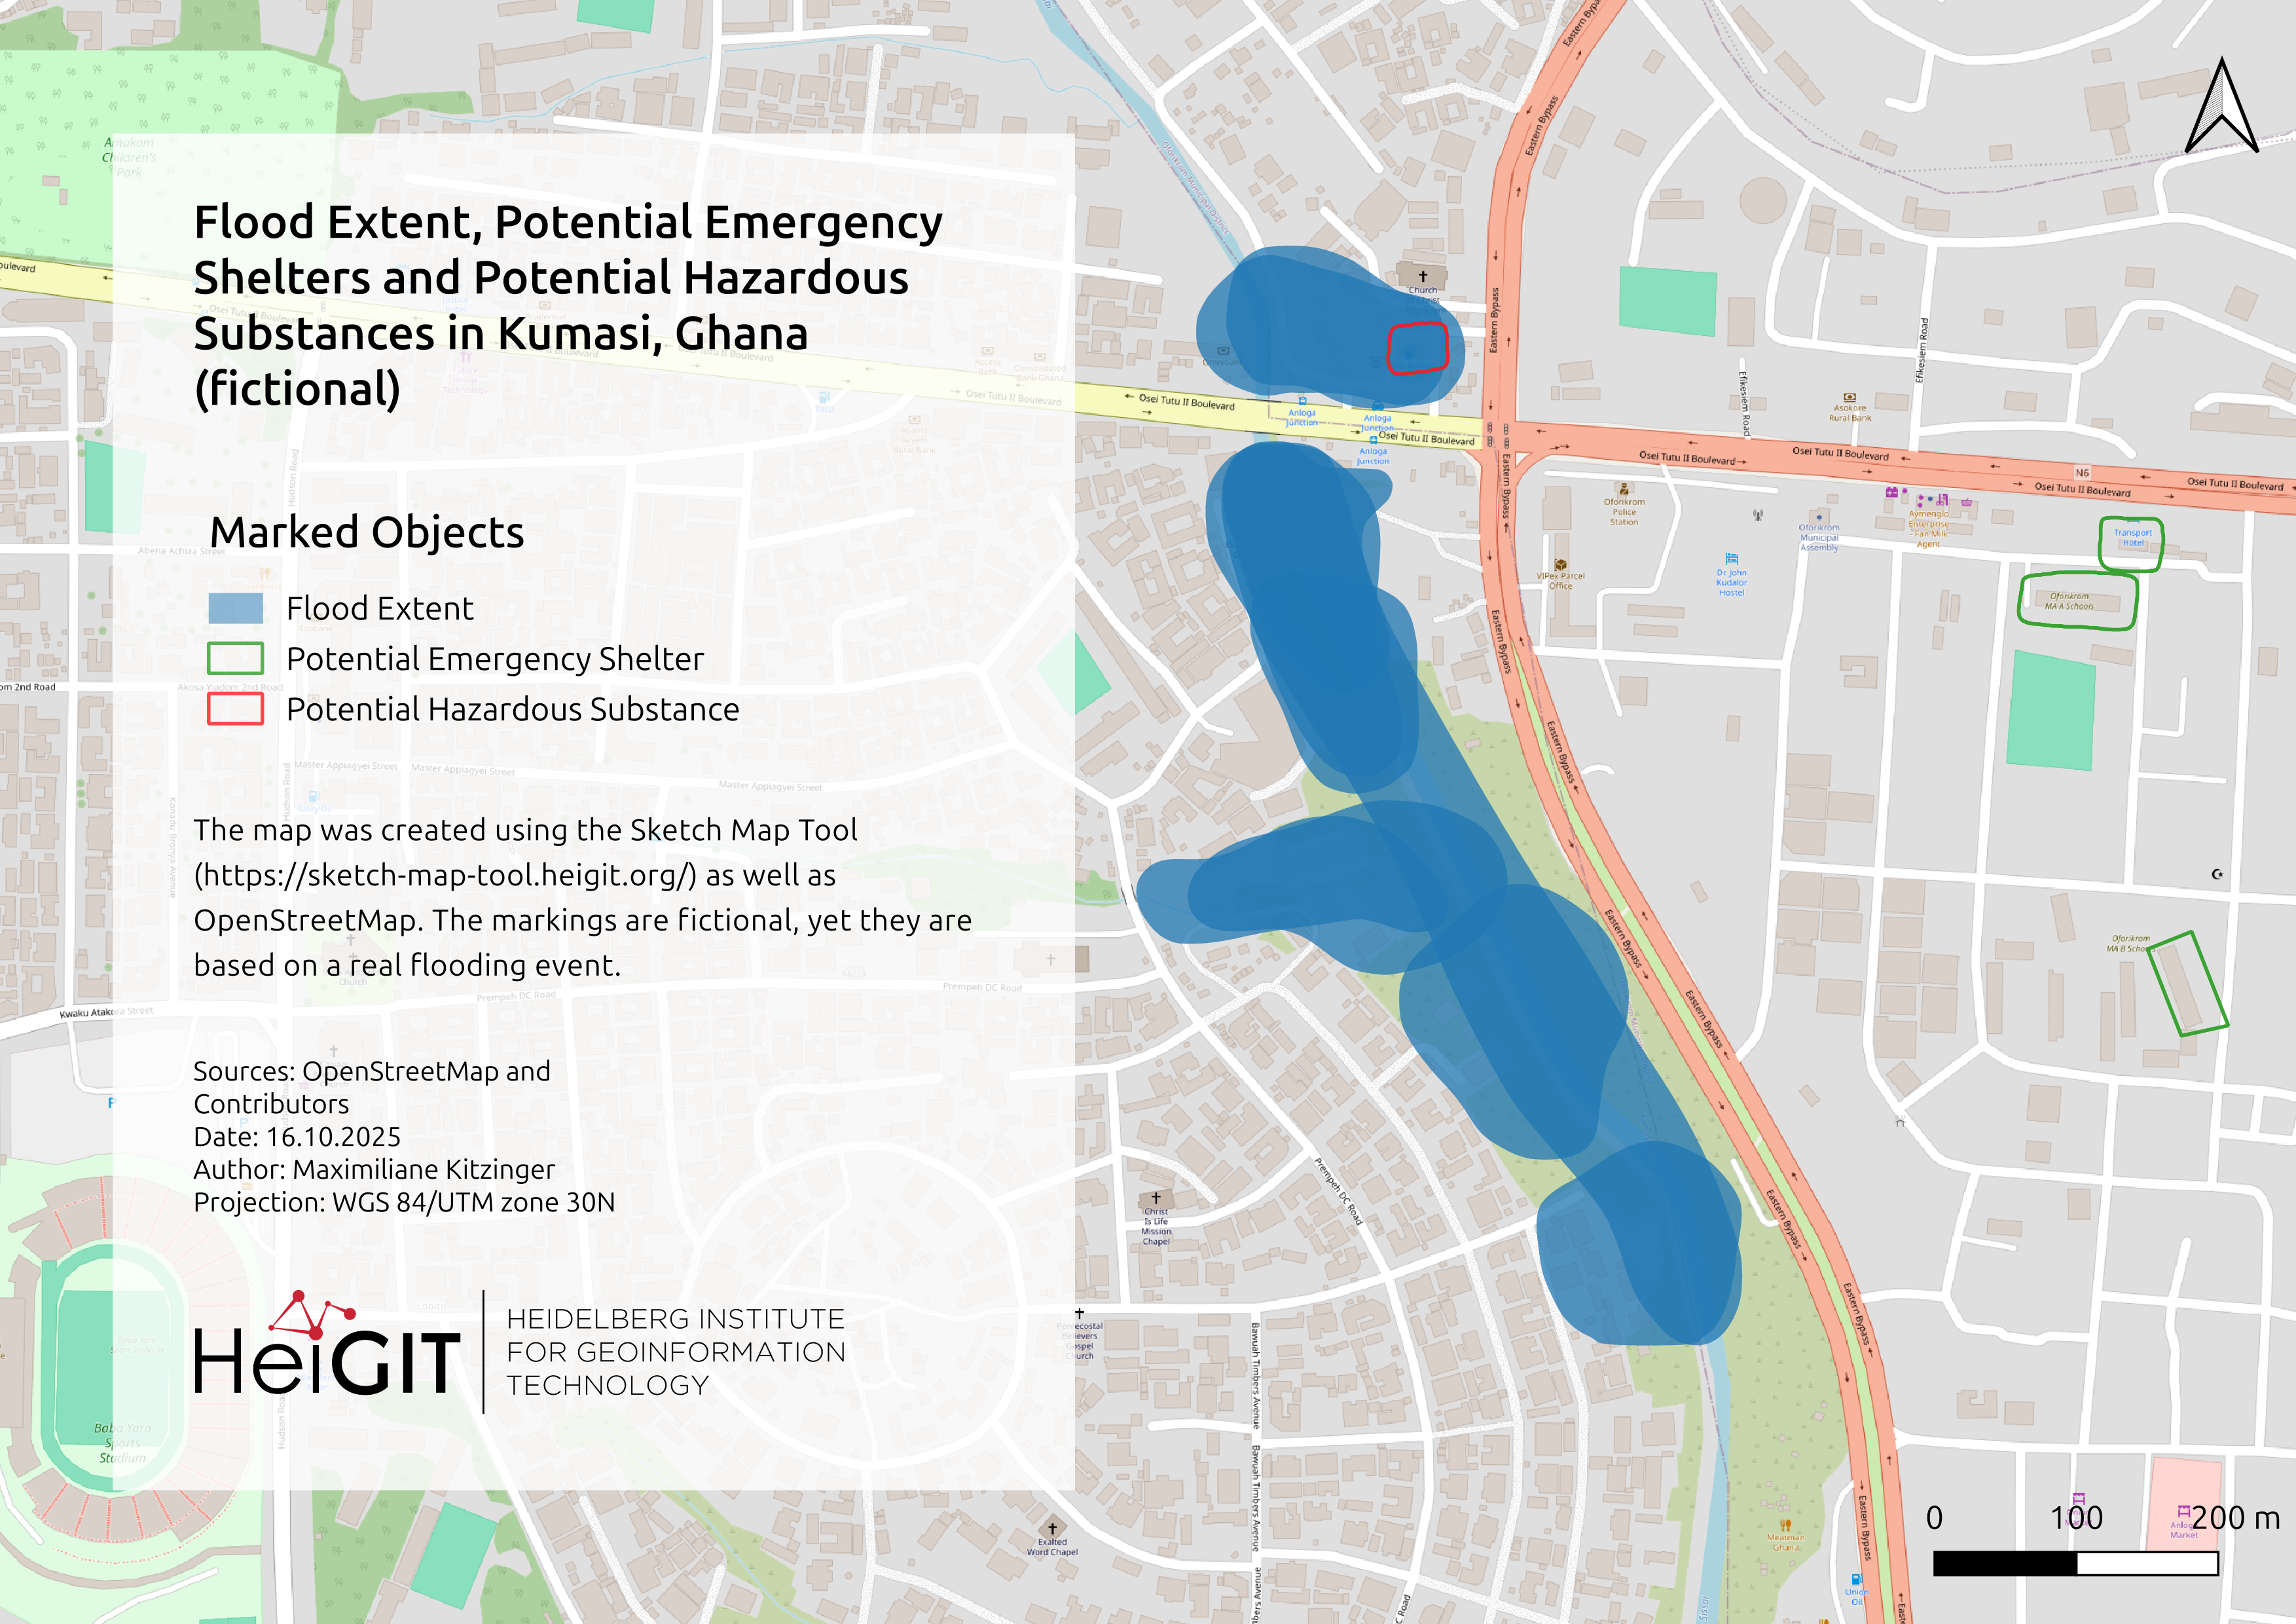
Fig. 163 Example of a finished map using the Sketch Map Tool#
You can find Videos along with all the necessary information about making printable maps and the print layout composer in the Print Layout Chapter, the Symbology Chapter, and in the Map Making Wiki
Exercise B: Basic visualization of Sketch Map Tool outputs in uMap #
Exercise B: Basic visualization of Sketch Map Tool outputs in uMap
1. Background Information on UMAP
uMap is an online platform that allows users to create custom maps with OpenStreetMap (OSM) as basemap layer. Neither installation nor registration is necessary. This enables users to quickly gain an intuitive overview of their data. Users can customize the appearance of the map and share it with others. It’s particularly useful for collaborative mapping projects, quick visualization of geographic data, and creating custom maps tailored to specific needs.
Feature |
QGIS |
UMAP |
|---|---|---|
Type |
Desktop Geographic Information System (GIS) software |
Online mapping platform |
Accessibility |
Requires installation on a desktop computer |
Accessible online via web browser |
Purpose |
Comprehensive GIS software for spatial data analysis |
Interactive mapping tool for creating custom maps |
Data Import |
Supports various data formats (shapefiles, geodatabases, etc.) |
Vector data only, user input via map canvas, some geo formats (geojson, .gpx, .kml, .osm) |
Data Visualization and Analysis |
Offers extensive visualization and analysis capabilities, Provides a wide range of spatial analysis tools |
Focuses on creating interactive maps with custom elements; No analysis tools |
Output |
Printable map with all necessary map elements |
URL so share map online |
Hint
The Geojson output of the Sketch Map Tool cannot be opened and inspected with commonly available tools. If you use the Sketch Map Tool and do not have QGIS installed but quickly want to examine your result, UMAP is a simple and quick way to do so. But be aware as it is an online platform, an internet connection is required.
2. Data Collection
Please download the prepared maps here. Unzip the .zip folder in order to be able to access the geotiff output.
Optional: You find the empty map in the data input folder: \Sketch_Map_Tool_Exercise_4\data\input\empty_sketch_map. Feel free to draw some additional flood maps by printing the template out and drawing on it or by using a simple graphics editor.
3. Georeferencing and auto-extraction with the Sketch Map tool
Upload the marked sketch maps back to the tool’s website (already marked sketch maps: \Sketch_Map_Tool_Exercise_4\data\input\marked_sketch_maps). Head to sketch-map-tool.heigit.org and choose ‘Digitize your Sketch maps’ on the right. Upload all your sketches in .png or .jpg format. You can mark your sketches and simply drag and drop them into the window.
The sketch maps are now being processed and georeferenced with the annotations extracted and vectorized. Download the vectors. You may use the ones we have prepared in the output data folder: \Sketch_Map_Tool_Exercise_4\output\Kumasi_SMT_Ex4.geojson.
4. Load your data
Open the Browser of your choice and navigate to the uMap Website and click on the large green button
Create a Map. Your Map Canvas and User interface will open.Right above your map canvas, you can click in “Untitled Map” in order to edit your map properties. Give your Map a title and a short description.
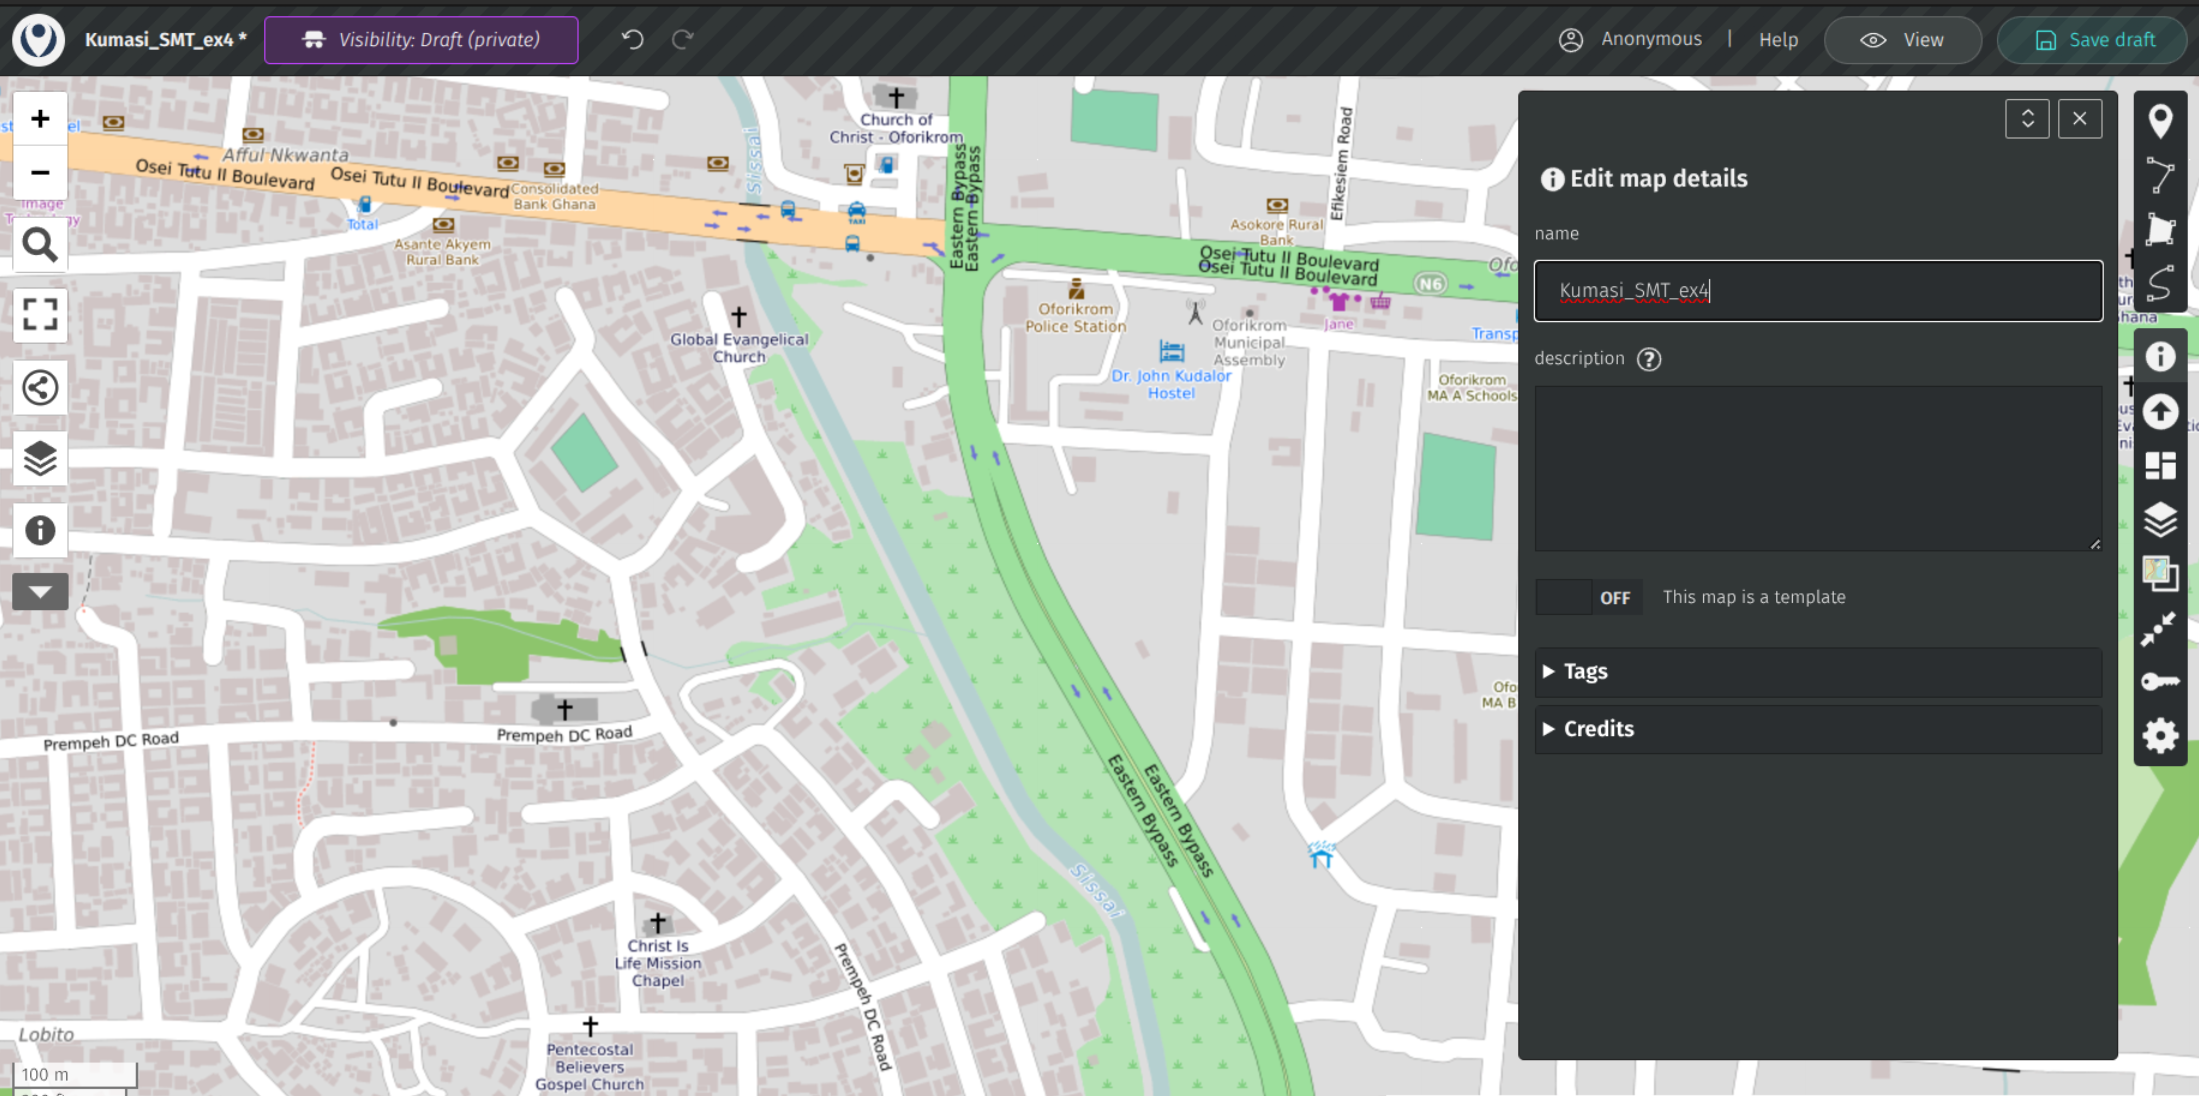
Fig. 164 Editing the map properties#
You can load your data into the map frame by clicking on the arrow button. The
Import datawindow will open on the right hand side. Click onSelect fileand navigate to your vector output from the Sketch Map Tool (“Kumasi_SMT_Ex4.geojson”) and click onOpen. uMap will automatically detect that your vector is a geojason format. Click onImportto load your data to your map canvas.
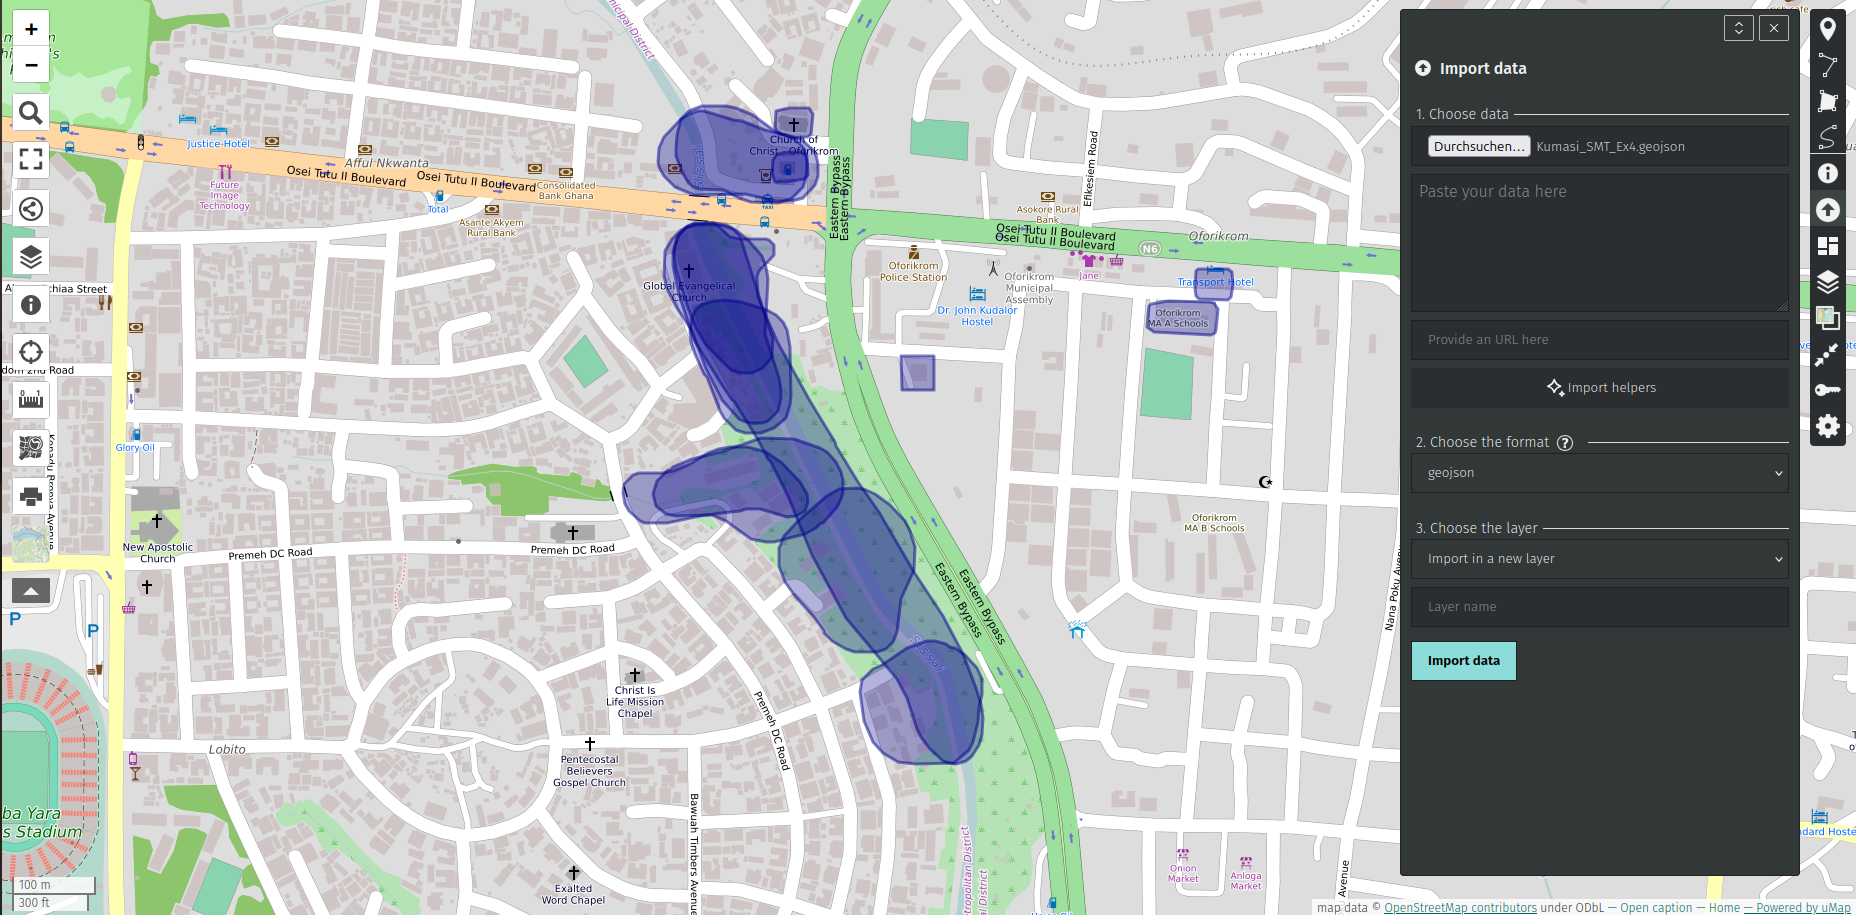
Fig. 165 uMap interface with the Sketch Map vectors#
Click in the upper right corner on
Save. If you are not logged in you will be provided with an URL where you can access and your map any time later on. Save it somewhere or send it to your email.
Attention
Without an account, the maps you create are stored temporarily in your browser’s local storage or session storage. This means that if you clear your browser’s cache or use a different device or browser, you may lose access to the maps you created.
Note
Generally, you can create maps, edit them, and share them with others on uMap without signing up for an account. However, if you decide to use uMAP frequently it might be beneficial to create an account. Signing up ensures persistent access to your created maps allowing to manage and edit maps over time. Also, some customization options or advanced features may only be available to registered users
5. Customize your map
Now that you imported your own data, you are ready to customize your own map in order to show your results to others in a vivid manner. In the toolbar on the right hand side you have various options to do so.
1. Change the background
Click on Change tilelayers to choose another background map.
2. Explore and Manage Data Layers
Click on Manage Layers to open your layers panel. In this windows you will see all the layers in your project (in our case it is just one) and you are able to add additional information layers. The small symbols on the left hand side of you layer give you the option to hide, zoom to or delete your layer.
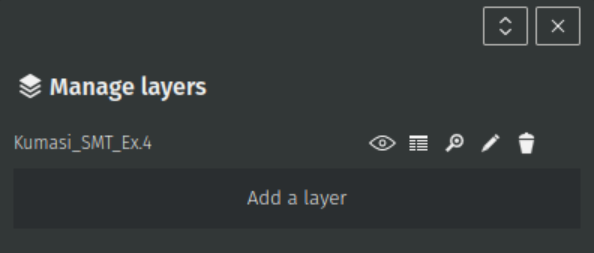
Fig. 166 Manage Layers Interface in uMap#
You can click on the table button  in order to view or edit properties in the attribute table of your layer. The table has one entry (row) for each detected marking. In our example 13 markings where detected. The column “color” describes the color which has been detected for each marking and the column “name” contains the name of your uploaded Sketch Map.
Note
Sketch Map Vector Output always have this same attribute table structure.
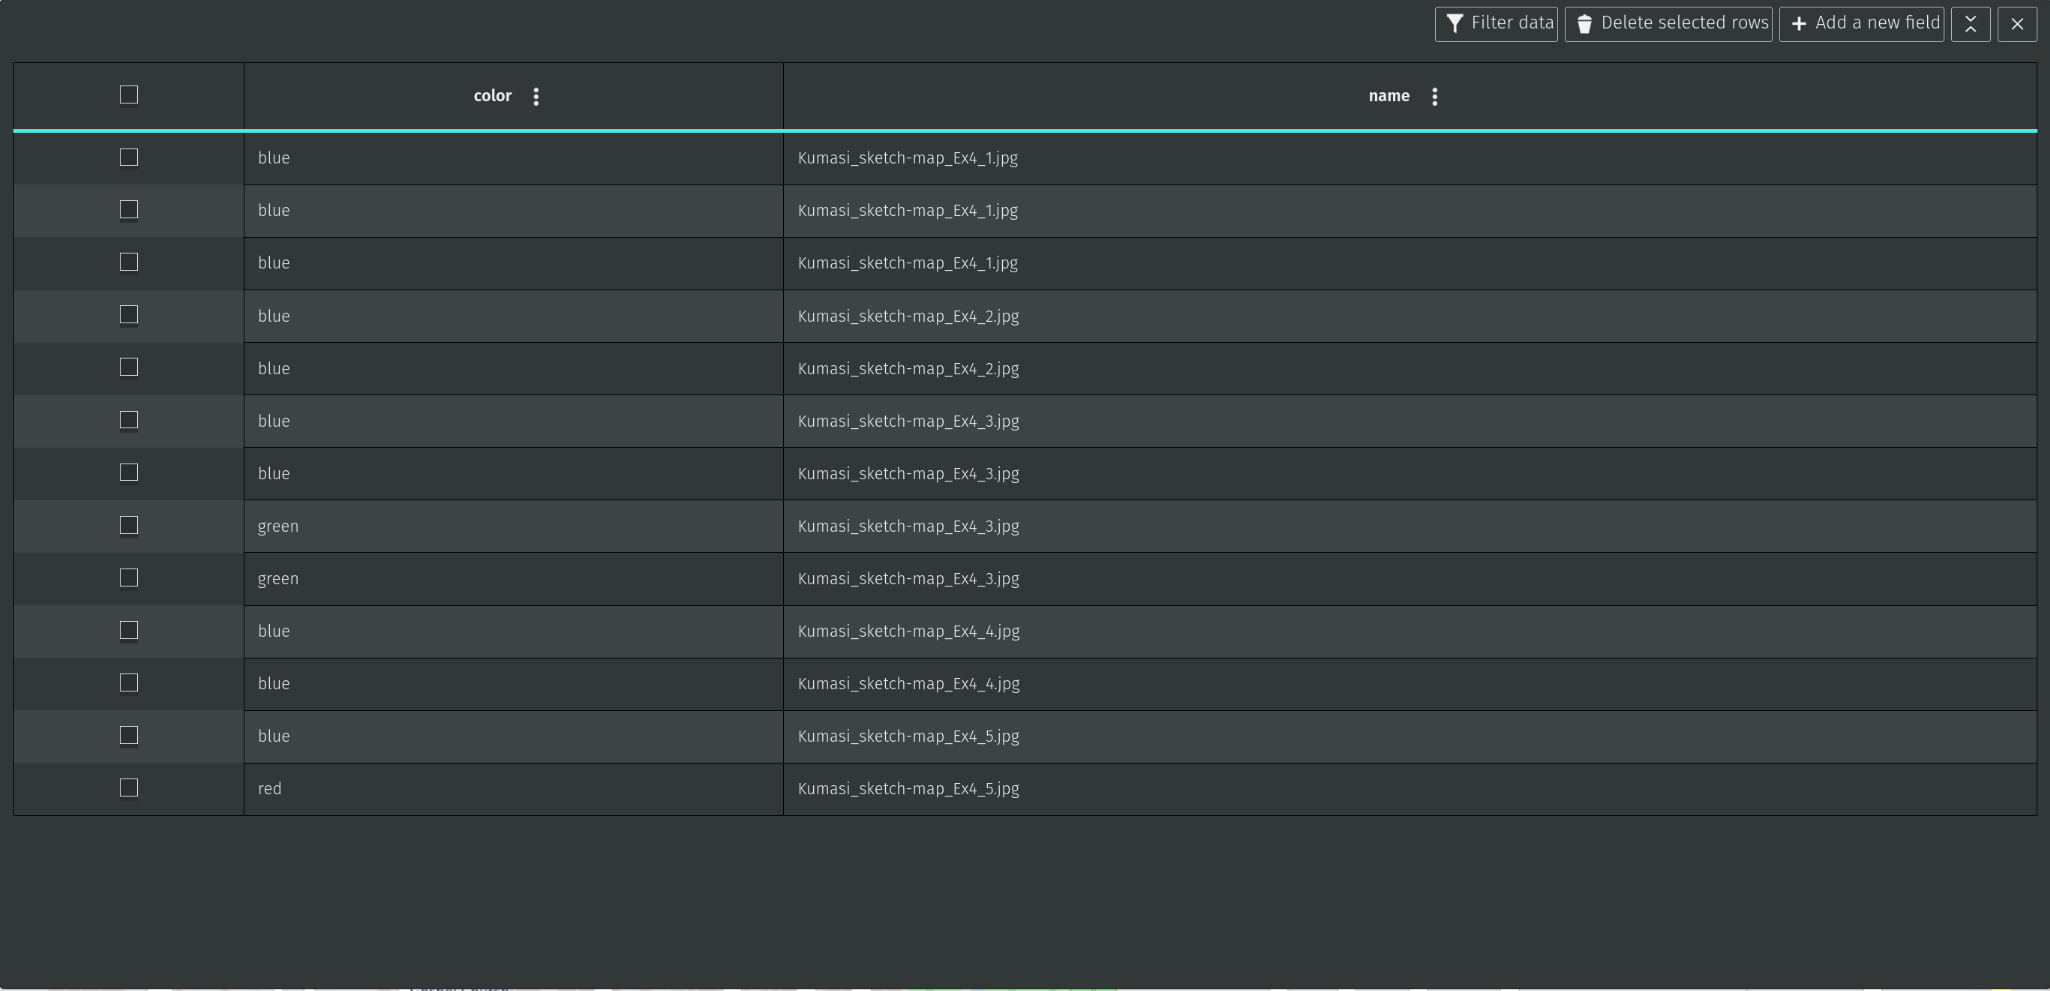
Fig. 167 Attribute Table in uMap#
2. Customize your visualization
Now we want to display the potential emergency shelters in green, potential hazardous substances in red and the flood extents in blue. For this we first have to create a group for each:
Click on
Manage Layers Add LayersWe name the first new layer “Potential Emergency Shelters” and choose as
Type of layer->ClusteredWhen you click onCloseand then onManage Layers again, you will see you recently create layer “Potential Emergency Shelters”
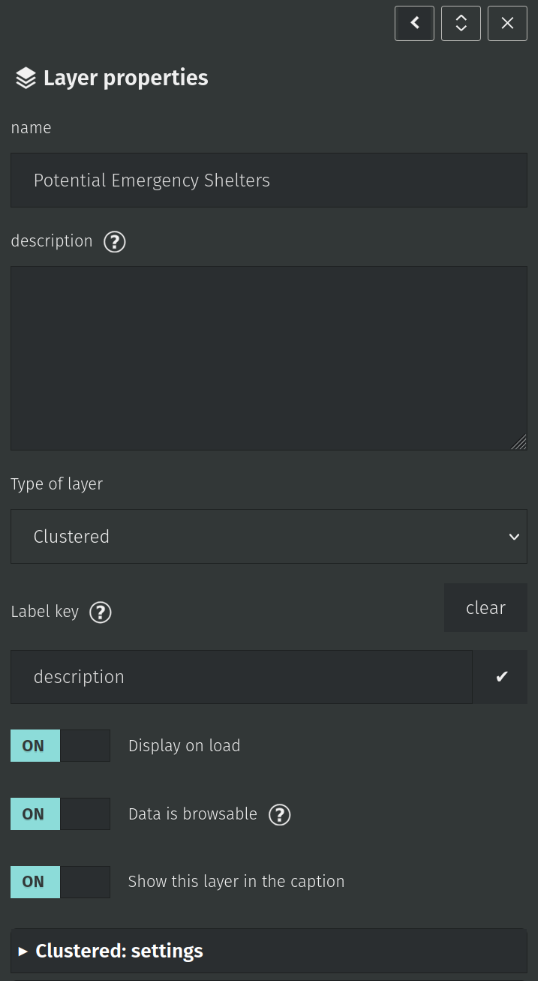
Fig. 168 Adding clustered layer#
repeat the process creating clustered layers for “Flood Extent” and “Potential Hazardous Substances”
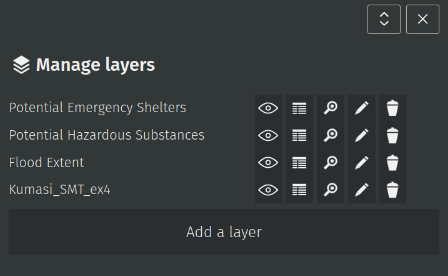
Fig. 169 The layer manager should look like this#
In the map canvas, you can now click on one of the polygons and toggle editing modus by clicking on the small pen button that appears.
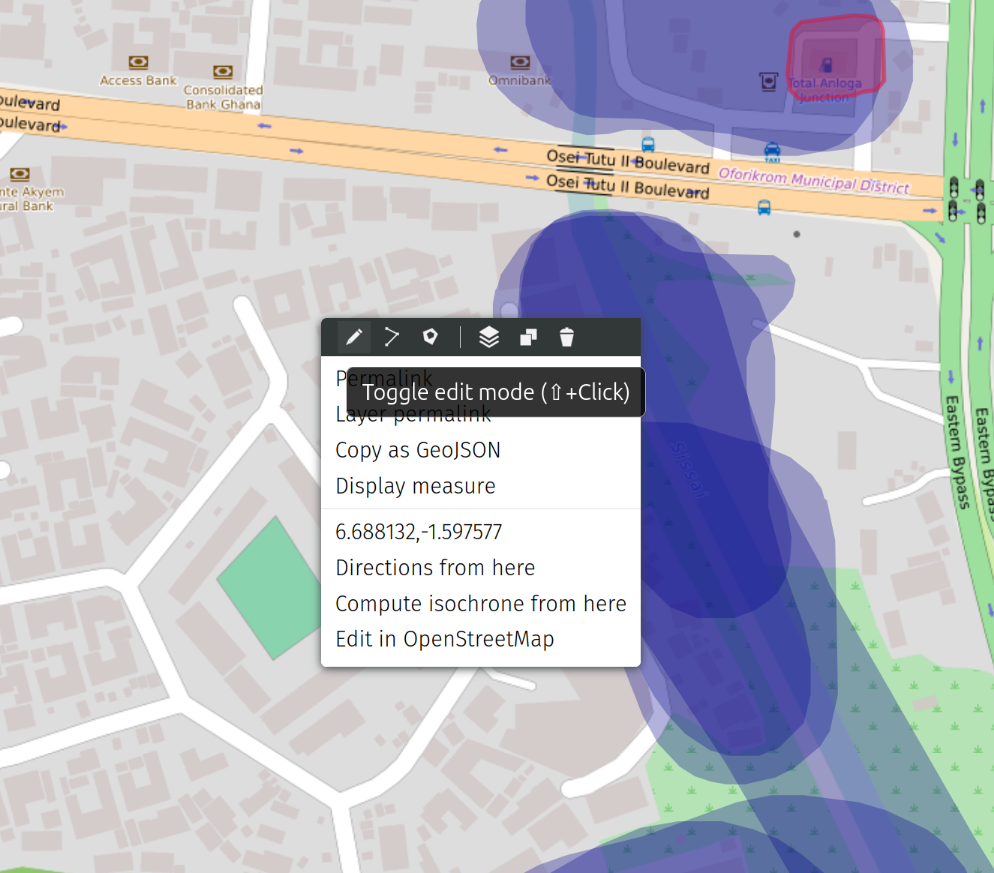
Fig. 170 Toggle editing#
The
Feature propertieswindow will open on the right hand side. On the very top, you can now choose the layer group you want to assign this feature to. Choose a meaningful name. For the flood polygons, we can simply choose as name “Flood Extent” and for the potential emergency shelters polygons you can either choose “Potential Emergency Shelter” or “school” or “hotel” as just an example. Click onClose. If you click on a flood extent polygon and toggle editing you assign it to you layer “Flood Extent” and if you click on a potential emergency shelter polygon and toggle editing you assign it to you layer “Potential Emergency Shelters”. Assign now all 13 polygons to the respective layer.
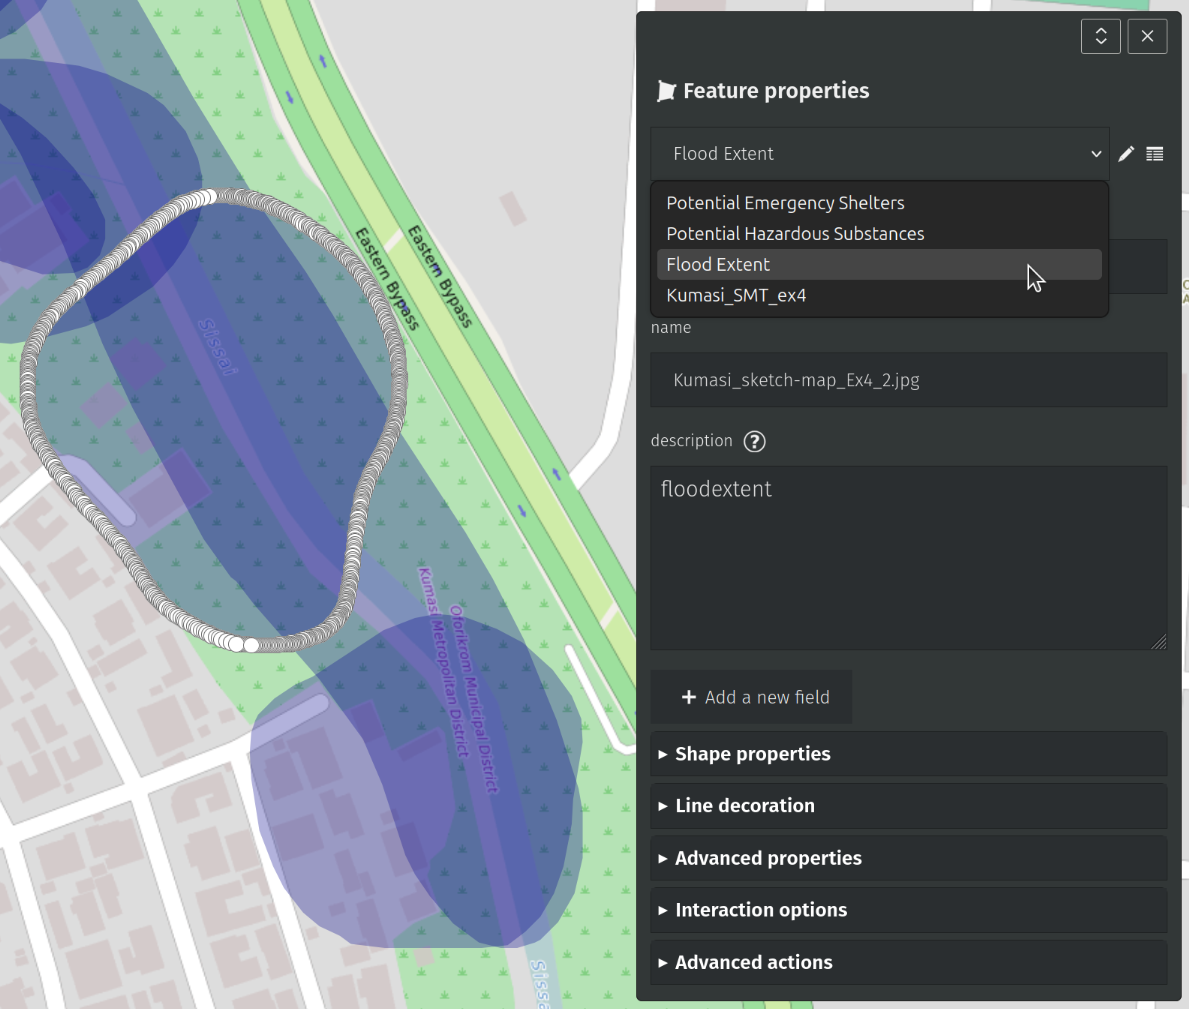
Fig. 171 Assign features to layers#
Now click on
Manage Layers again and Edit one of your new layers (e.g. “Flood Extent”). Click on
 Shape Propertiesto change the color of the layer. You can explore other option you have for styling your features. You finish by clicking onClosein the upper right corner.In
Interaction Optionsthe behavior of the labeling can be determined. For example, you can choosePopupasPopup shapeand setDisplay labeleitheron hoverin order to only display the features descriptions when you scroll with the mouse over the respective feature on the map, or onalways, in order to always see the respective description.
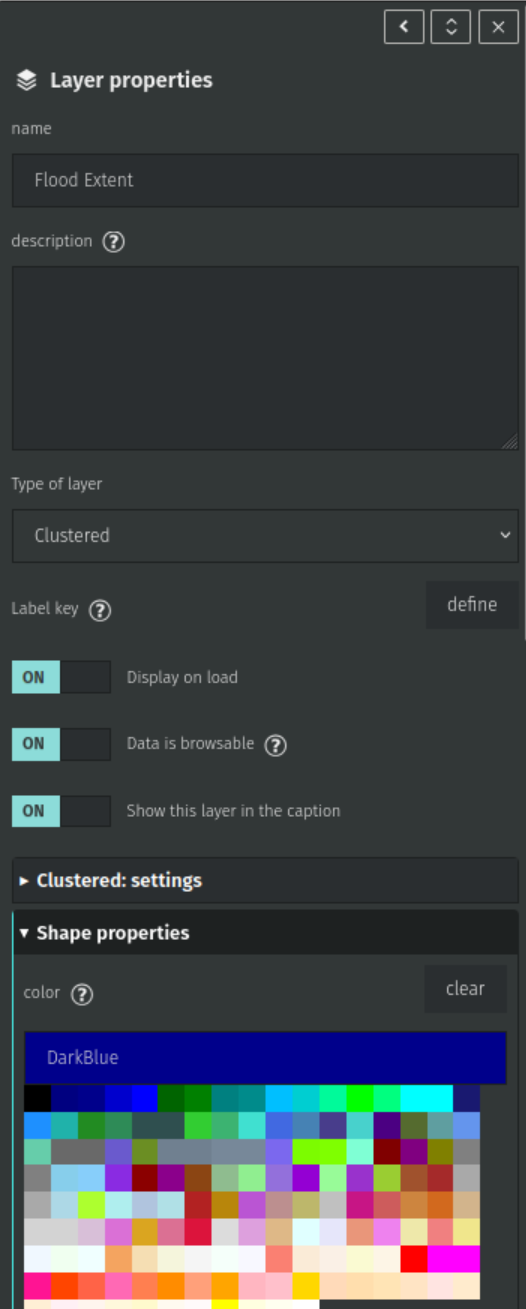
Fig. 172 Shape properties interface in UMAP#
6. Save and publish your map
Your map could now look like this:
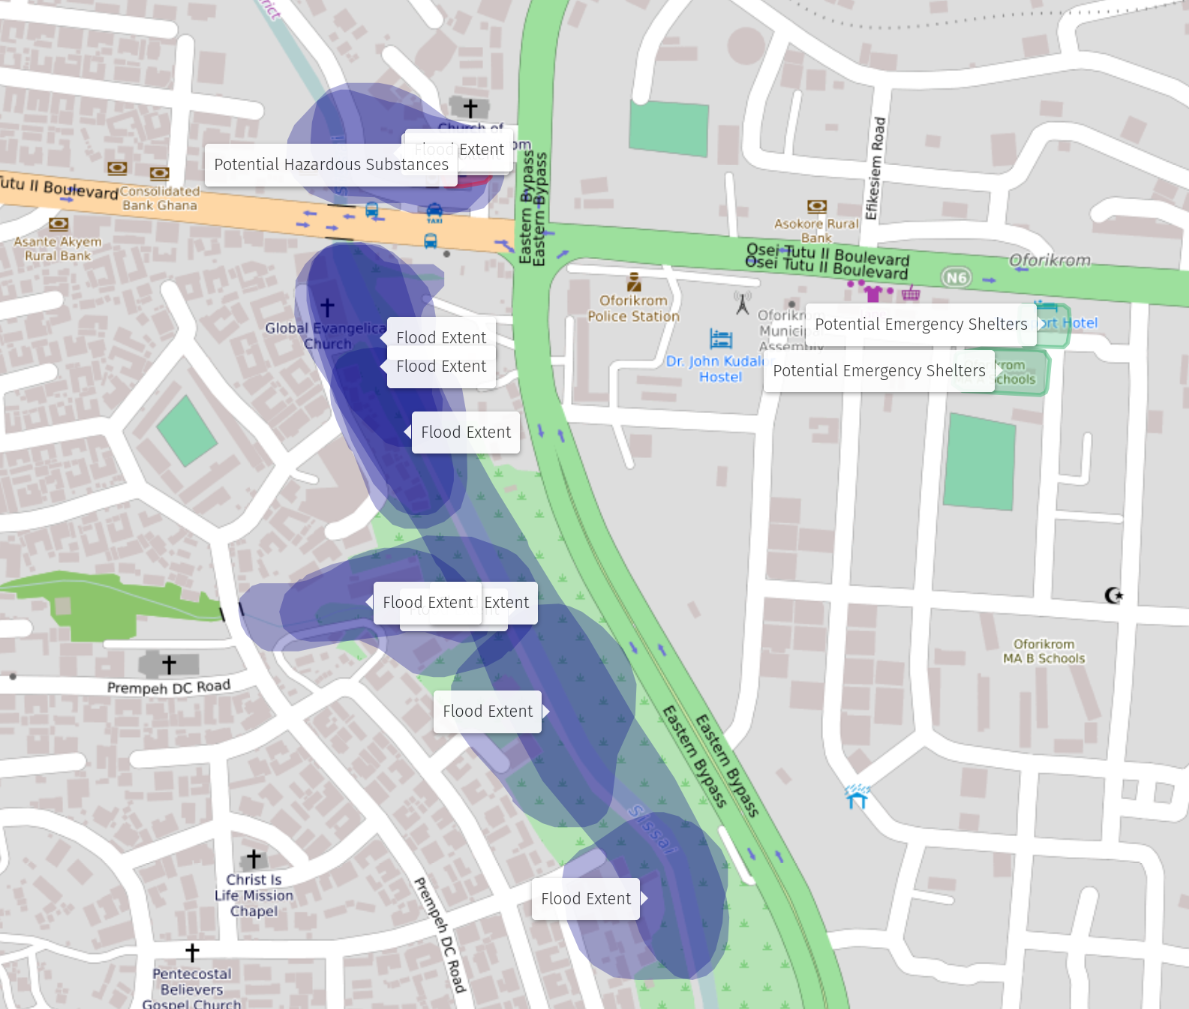
Fig. 173 Finalized Map in UMAP#
If you have displayed everything you want and you have zoomed to the map extent of your choice, you can click on Save this center and zoom in order to save your map section. Next, click on
 Save in the upper right corner.
In order to publish the map, you can click on Share and download on the menu bar on the left side.
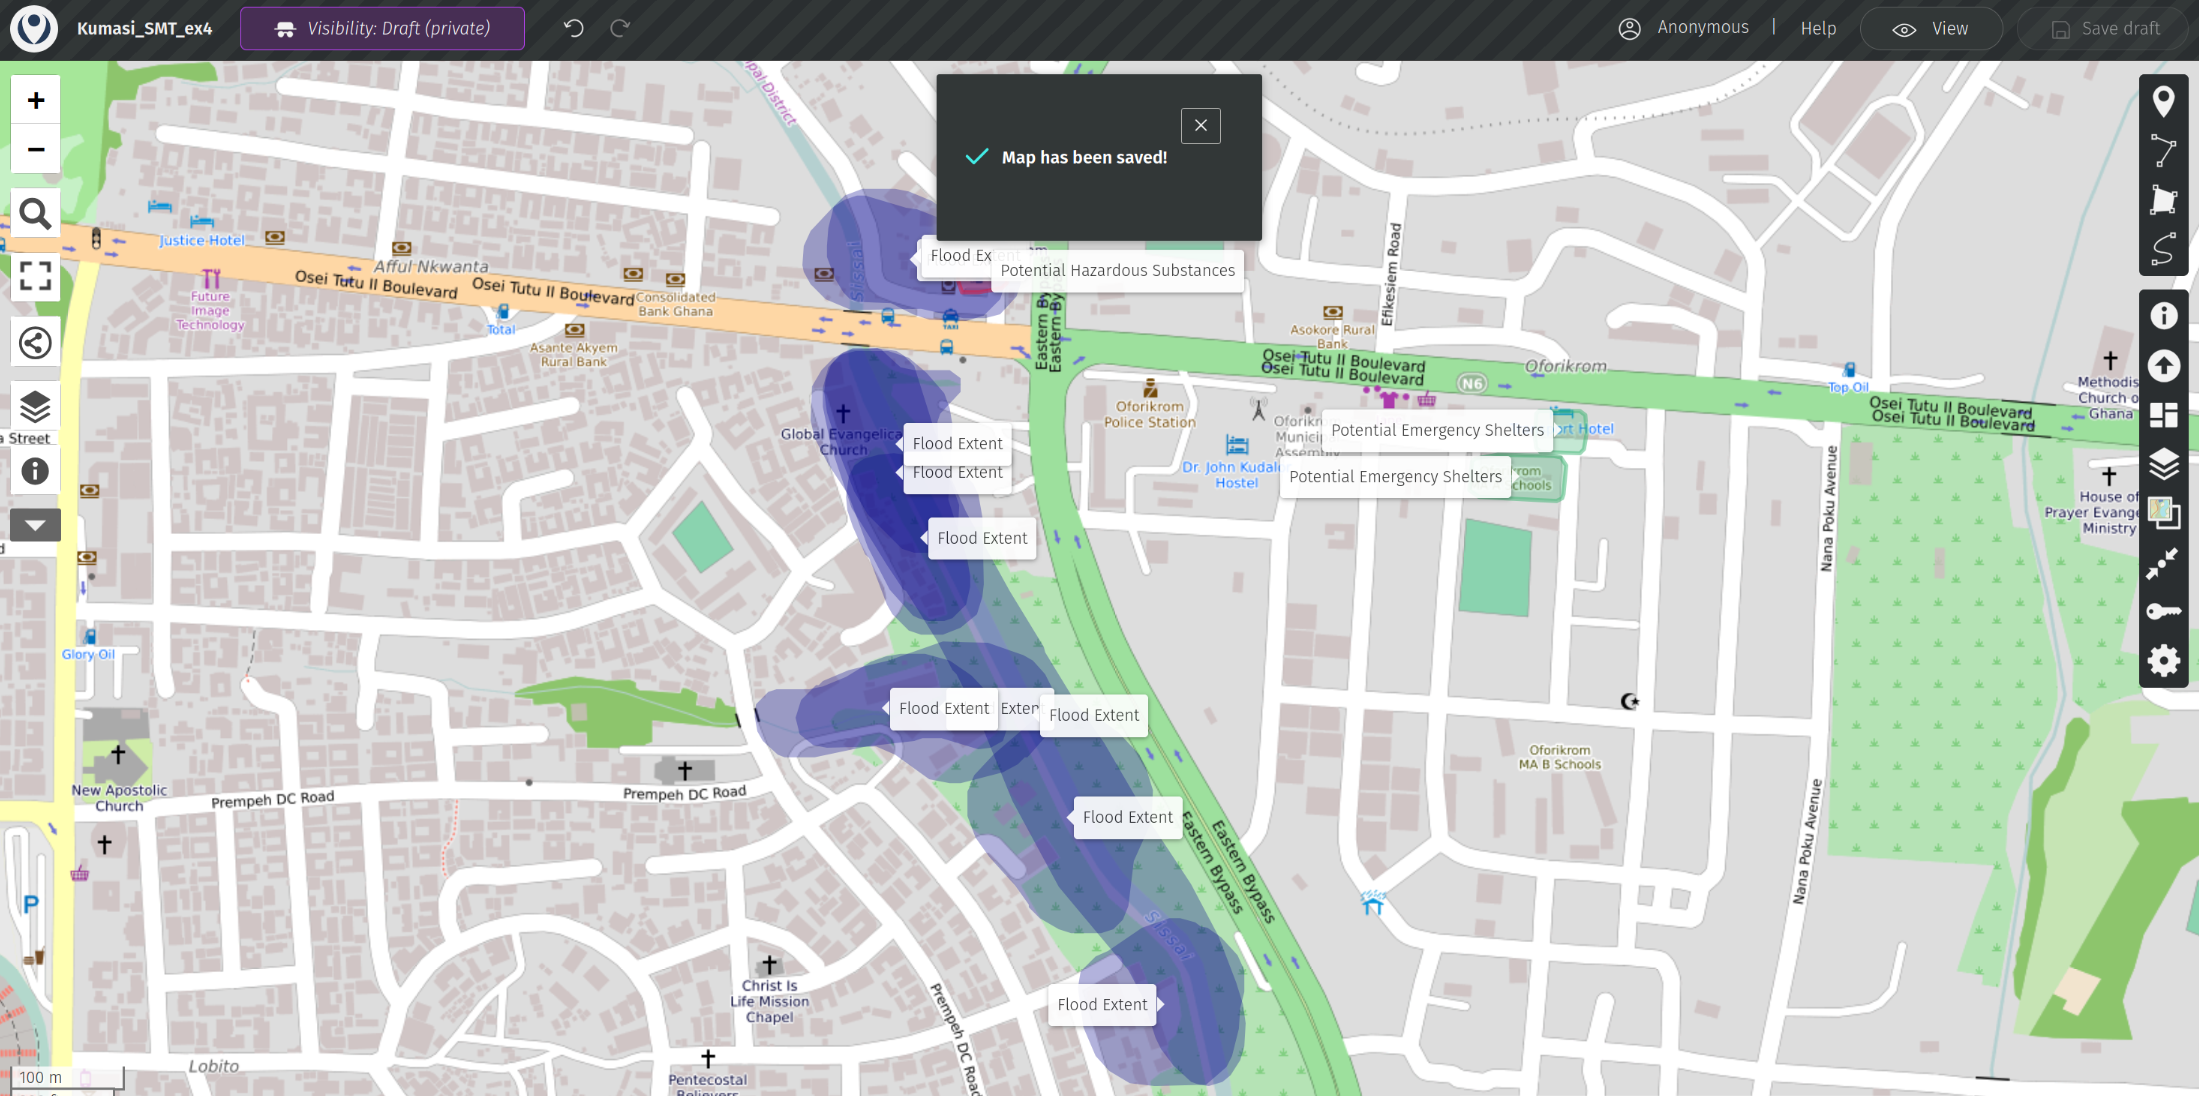
Fig. 174 Share and download interface in uMap#
On the top beneath Link to view the map, you receive a URL that you can share with other people so they can view the map you have created.
You also have the option to download your layers as data files, a full backup of the project or to copy an iframe link so you can embed your map on your own website.
Hint
If you want to use your map as a simple figure to show offline, you can simply take a screenshot or use the Snipping Tool.