4.5. Symbology for Raster Data #
As we have already learned, raster data are basically a grid of pixels with different (numerical) values. As such, you can’t style the shape, fill or outline of raster data. Raster data is visualized by assigning a colour ramp to the pixel value. QGIS offers several options to visualise raster data. For example, you can create a hillshade with a digital elevation model (DEM). This small chapter only covers the basics of visualising raster data. If you want to learn more about raster data and how to work with raster layers, take a look at module 8.
4.5.1. Assigning a colour gradient to raster data #
To assign a colour gradient for raster data, you need to:
Open the
styling panelfor the raster layer.Navigate to the
Symbology tab.By default, the colour scheme is set to Singleband Gray (if you only have one colour band in the data set). Click on
Singleband Grayand switch toSingleband Pseudocolour.Click on the arrow to the right of the colour ramp. Here you can choose a pre-made colour ramp.
You can modify the colour ramp by clicking on the colour ramp.
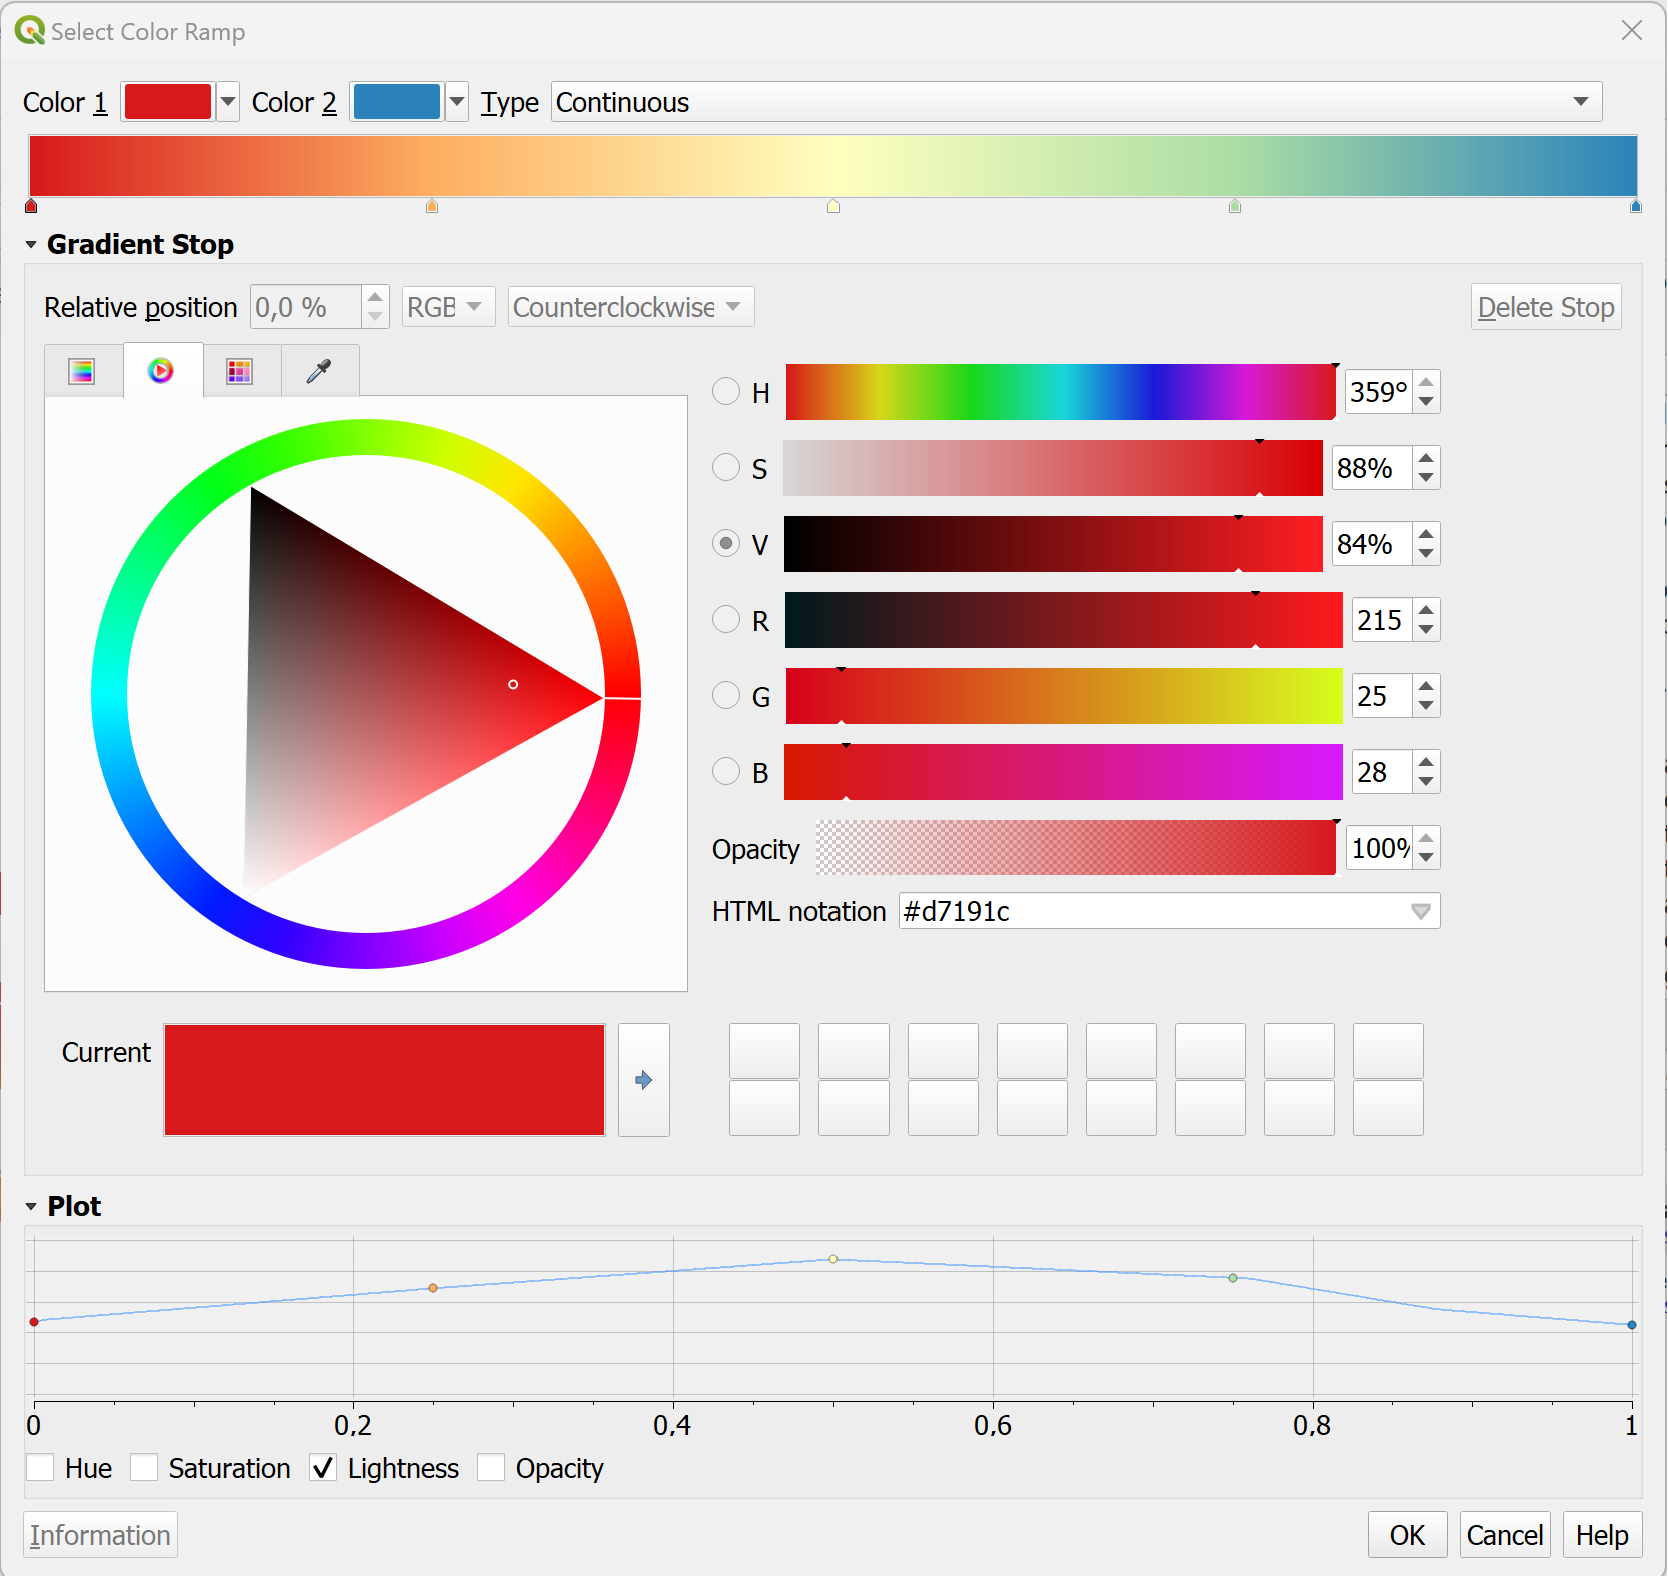
Fig. 4.41 Colour Ramp Selector in QGIS 3.36.#
In the colour ramp selector, you can adjust each colour step. On the bottom, you can see a plot for the Hue, Saturation, Lightness and Opacity. The last three in particular are useful to understand how your colour ramp will appear. Gradients from light to dark are easier to read: Check if the plot for the Lightness has a more or less linear plot.
4.5.2. Inverting the colour ramp #
In some cases, the colour ramp should be inverted to make it easier to read the map:
Click on the arrow next to the Colour ramp to open the dropdown menu.
Click on
Invert Colour Ramp.
4.5.3. Using better colour palettes #
Note
The default colour ramps available in QGIS are limited and do not fit a lot of cartography purposes. However, QGIS includes the cpt-city colour palette catalogue with many carefully crafted colour ramps and palettes. Amongst other, you can find colour ramps specifically created for terrain or elevation models.
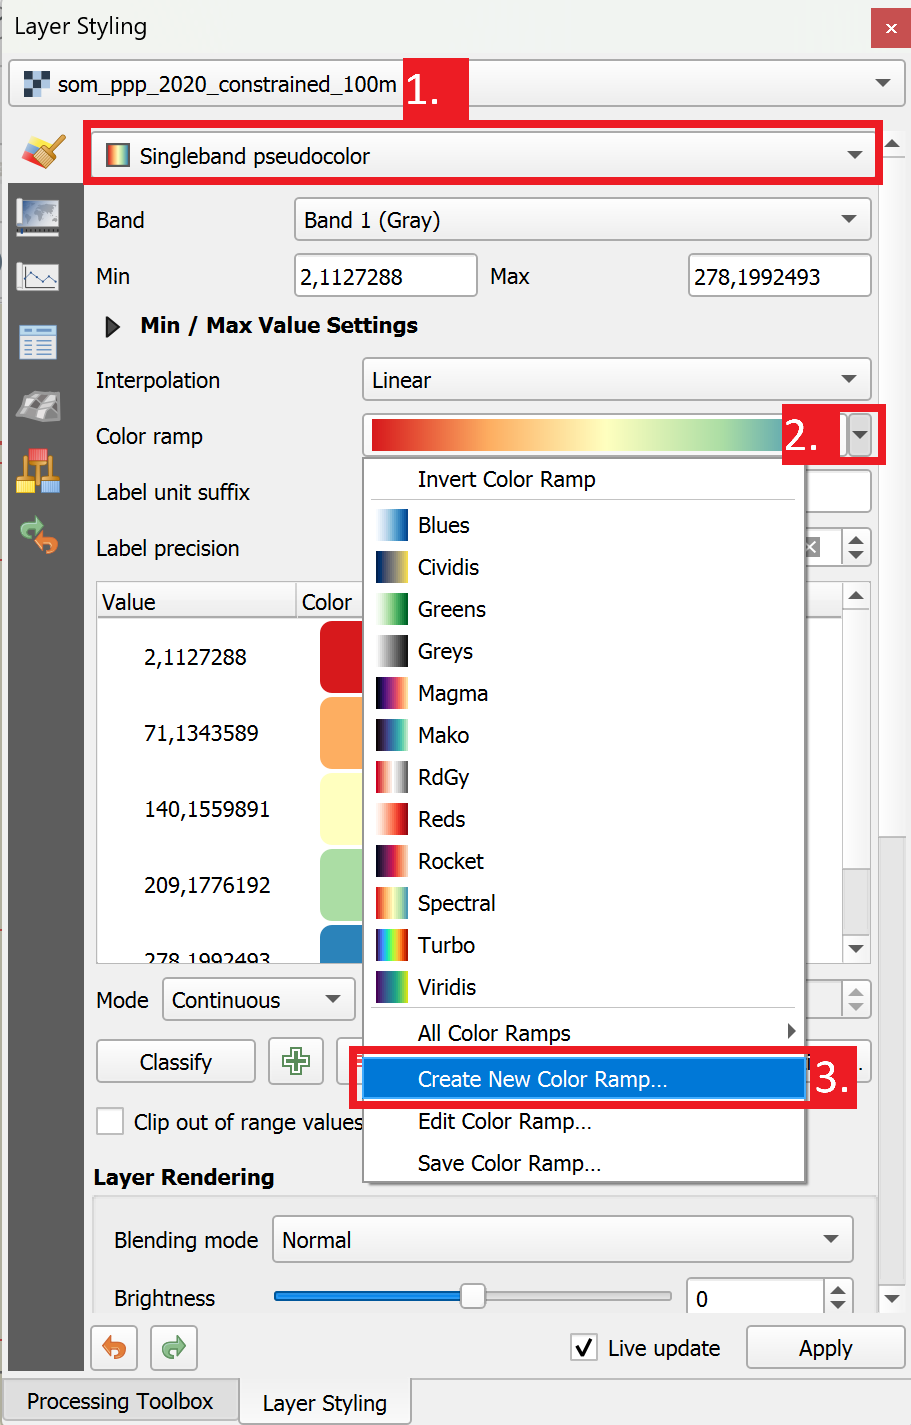
Fig. 4.42 Accessing the colour catalogue.#
To access the cpt-city catalogue,
Open the raster layers symbology tab and select
Singleband Pseudocoloras the symbolisation method.Navigate to the dropdown arrow next to the colour ramp, a dropdown menu with different colour ramps will open.
Click on
Create New Color Ramp. A small dialogue box will open.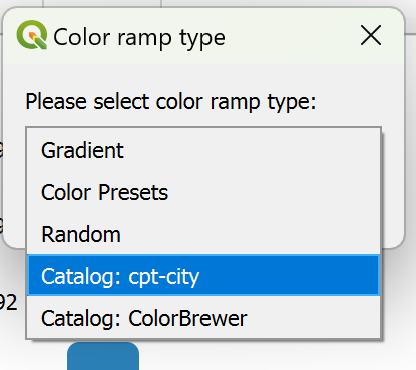
Fig. 4.43 Selecting the colour ramp catalogue#
A new window will open. Here you can find a multitude of colour palettes. For example, for a digital elevation model you can select a colour ramp for topography or specifically digital elevation models.
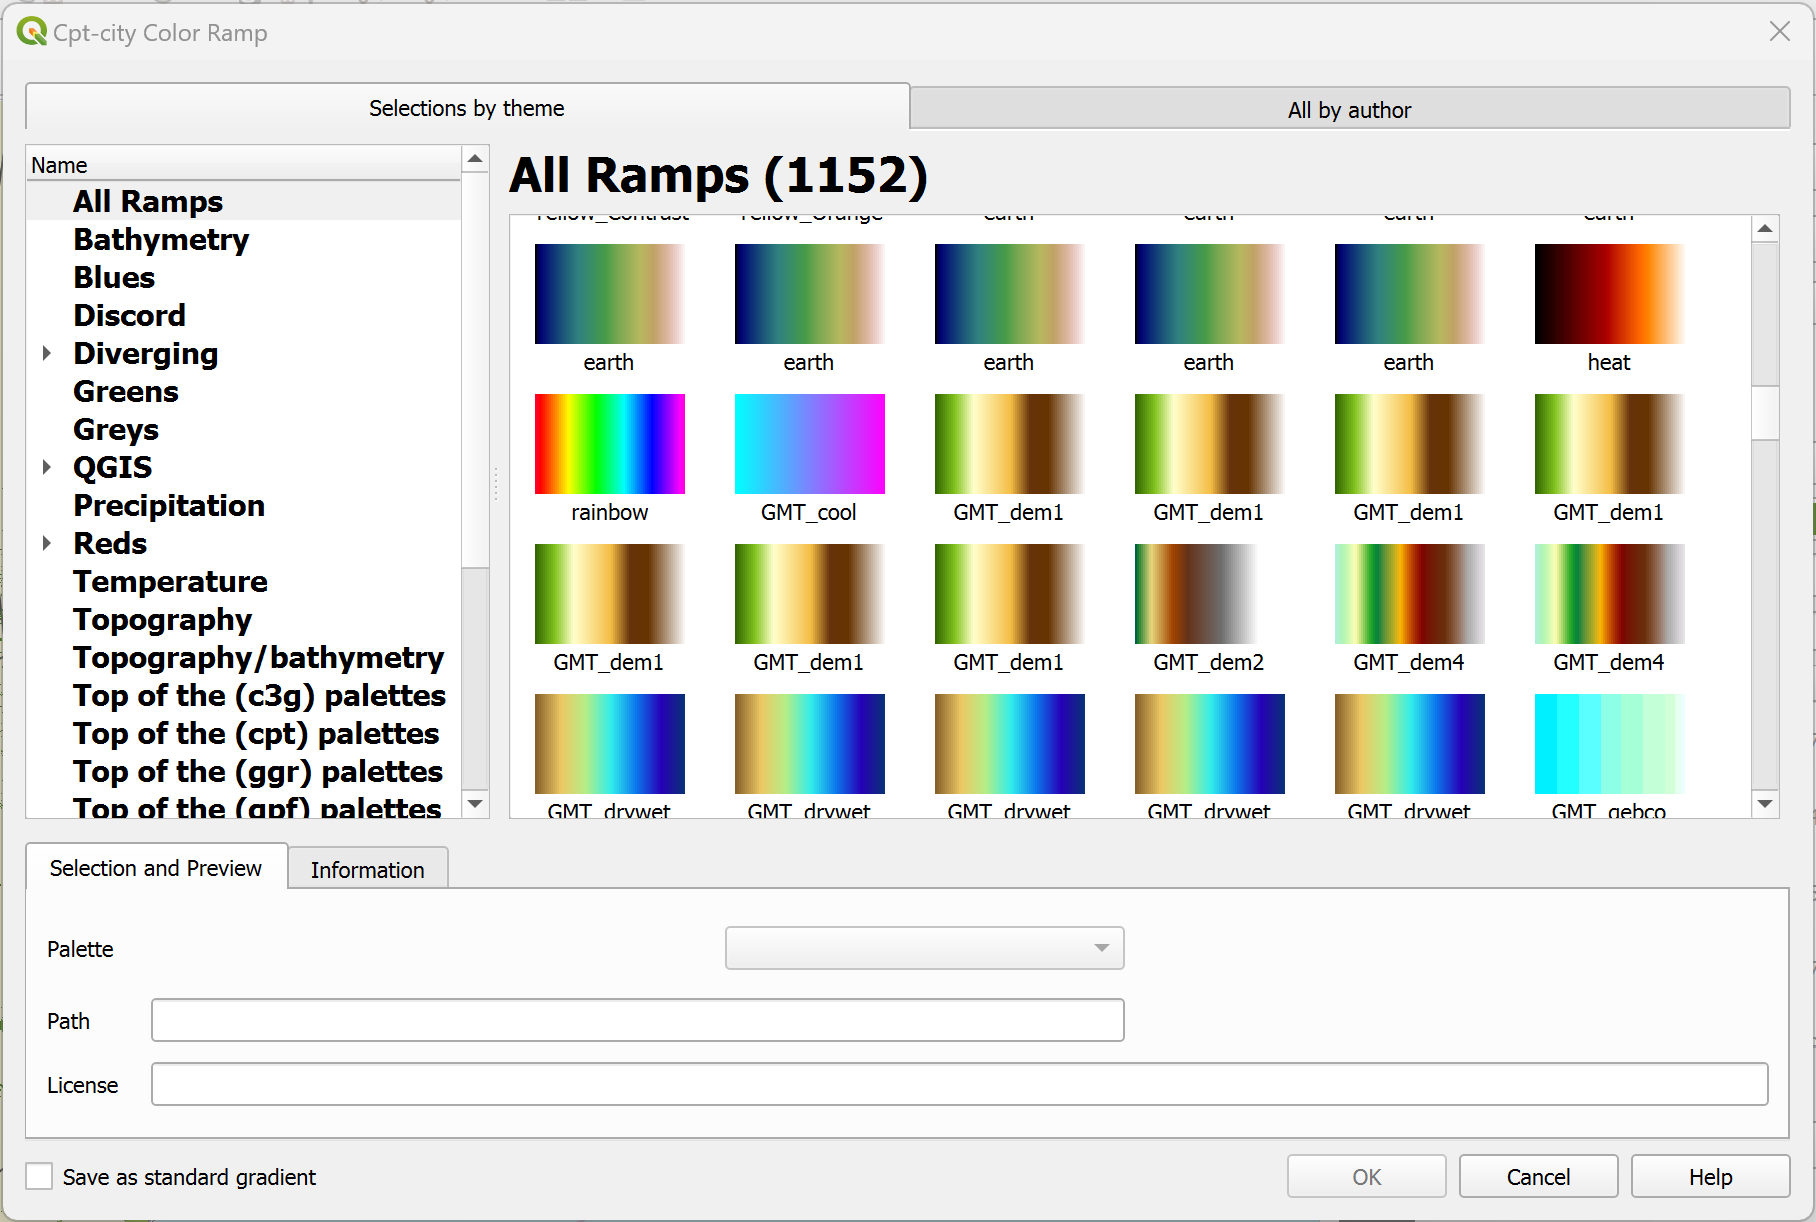
Fig. 4.44 The cpt-city colour ramp catalogue in QGIS 3.36#
4.5.4. Self-Assessment Questions #
Test your knowledge
Why can’t you style a raster layer by changing “fill” or “outline” in the way you do with vector data?
Answer
Raster data are made of pixels (cells), each with a value (e.g. elevation, reflectance), not discrete geometries. So there is no “outline” to stroke, nor a single “fill” for the whole polygon.
Styling rasters is about mapping pixel values to colours, rather than applying boundary or fill styling to features.
Vector styling operates on geometric features (points, lines, polygons) and you can control fills, strokes, shapes etc.; but raster styling works by symbology/rendering algorithms (colour ramping, stretching, classification) on the continuous grid of values.
What is the default rendering style for a single‑band raster in QGIS, and into what style is it commonly changed for better visualisation?
Answer
The default rendering for a single‑band raster is Singleband gray (grayscale) — low values are darker, high values are lighter.
For better visualization, it’s common to change it to Singleband pseudocolor (i.e. assign a color ramp) so that variations in values are more visually distinct.
What is a “colour ramp” (or gradient) in the context of raster symbology, and how does it help interpret the data?
Answer
A colour ramp (or gradient) is a continuous range of colours that are mapped to the range of raster values (from minimum to maximaum).
By mapping increasing (or decreasing) values to a progression of colours, the reader can visually interpret the magnitude, gradients, and spatial patterns of the underlying numeric data.
The use of colour (rather than just grey) can help emphasise meaningful thresholds, critical values (e.g., very high or low), and improve readability and visual appeal.
A well‐designed colour ramp can highlight differences (e.g., higher vs lower values), reveal spatial structure (e.g., peaks, valleys, clusters), and make the raster meaningful rather than just a grey blob.
Give an example of a raster dataset (e.g. digital elevation model, NDVI, precipitation) and propose a suitable colour ramp or palette you might use in QGIS
Answer
Example: A digital elevation model (DEM) representing terrain elevation (in metres) __Proposed suitable colour ramp/palette:
Lower elevations: dark green (lowland)
Mid elevations: light green → yellow (gentle slopes)
Higher elevations: orange → brown (steep slopes/upper terrain)
Highest elevations/peaks: white (snow/ice caps)
In QGIS you might choose a ramp like “Terrain (elevation)” or a custom ramp from the cpt‑city catalogue (the module mentions that QGIS includes the cpt‑city colour palette catalogue with many carefully crafted colour ramps, including ones for elevation models).
When designing a colour ramp for raster data (e.g. elevation, temperature), what should you watch out for in terms of lightness, hue, or perceptual uniformity?
Answer
Lightness/darkness progression: A progression from lighter to darker colours are easier to read. QGIS has a lightness plot in the colour ramp editor. If lightness jumps up and down irregularly, some segments may appear visually more prominent than others. Additionally, colours ramps with irregular lightness do not translate to black and white prints. In general, irregular colour ramps are less intuitive to read.
Hue shifts: Sudden changes in hue may draw undue attention and may imply categorical rather than continuous differences. If hues change dramatically while lightness remains constant, it may mislead the reader into thinking there are discrete classes.
Avoiding misleading associations: Colours carry cultural or intuitive meanings (e.g. red = hot/danger, blue = cold, green = vegetation). If you ramp uses unusual colour, the meaning may confuse.
Contrast and readability: Very dark segments may hide detail; very light segments may fade out. Also consider how the ramp will appear when printed, in greyscale, or by colour‐impaired readers.
Interpretation of extremes and middle ranges: If the ramp has extreme jumps at the ends or very flat mid‐range, you might lose nuance in important segments. Also avoid ramps that place extremes at colours that are visually “loud” and overshadow moderate values.