Exercise 6: Exporting Model Results for the Operations Team #
Characteristics of the exercise #
Type of trainings exercise:
This exercise can be used in online and presence training.
It can be done as a follow-along exercise or individually as a self-study.
Exercise Track:
This exercise is part of the Madagascar Anticipatory Action Cyclon Analysis Exercise Track
Estimated time demand for the exercise
Relevant Wiki Articles
Aim of the exercise:
Aina, the GIS expert at the Malagasy Red Cross (CRM), is preparing for the upcoming cyclone season. She wants to improve her team’s ability to act quickly once a storm is forecasted by automating key analyses in QGIS. These include estimating exposed populations, identifying impacted services like health and education, and assessing whether health posts can be reached from key warehouses within a critical 10-hour window. The goal is to prepare an end-to-end analysis and visualization workflow that can support fast, data-driven anticipatory action before a cyclone makes landfall.
Instructions for the trainers #
Trainers Corner
Prepare the training
Take the time to familiarise yourself with the exercise and the provided material.
Prepare a white-board. It can be either a physical whiteboard, a flip-chart, or a digital whiteboard (e.g. Miro board) where the participants can add their findings and questions.
Before starting the exercise, make sure everybody has installed QGIS and has downloaded and unzipped the data folder.
Check out How to do trainings? for some general tips on training conduction
Conduct the training
Introduction:
Introduce the idea and aim of the exercise.
Provide the download link and make sure everybody has unzipped the folder before beginning the tasks.
Follow-along:
Show and explain each step yourself at least twice and slow enough so everybody can see what you are doing, and follow along in their own QGIS-project.
Make sure that everybody is following along and doing the steps themselves by periodically asking if anybody needs help or if everybody is still following.
Be open and patient to every question or problem that might come up. Your participants are essentially multitasking by paying attention to your instructions and orienting themselves in their own QGIS-project.
Wrap up:
Leave time for any issues or questions concerning the tasks at the end of the exercise.
Leave some time for open questions.
Available data #
Download all datasets here, save the folder on your computer and unzip the file.
Context – Aina Supports Decision Makers
After producing maps and visuals, Aina often gets requests from the operations team:
“Can you send us the data in table format?”
Instead of exporting these tables manually each time, Aina wants to automate this step within her model — ensuring that every run of the model produces clear, ready-to-use data files.
In this task, you’ll help Aina extend her existing model to export selected layers.
We will join the following layers step by step:
admin2_health_affected_pct:
Contains the total number of health facilities, the number of affected health facilities, and the percentage of affected health facilities.admin2_education_affected_pct:
Contains the total number of education facilities, the number of affected education facilities, and the percentage of affected education facilities.exposed_population:
Contains the total population per district and the exposed population from the zonal statistics step.
Tasks #
Open your model
Open
Estimate_Exposed_Population_Health_EducationSave a new version as:
Estimate_Exposed_Population_Health_Education_Spreadsheet_Export
Join Health and Education data into one layer
In the Algorithms, search for
Join Attributes by Field Value.Add a description:
Joindre santé et éducation dans une seule couche par ADM2Configure the algorithm as follows:
Input Layer:
admin2_health_affected(select from Algorithm Output)Input Layer 2:
admin2_education_affected(select from Algorithm Output)Table field:
ADM2_PCODETable field 2:
ADM2_PCODELayer 2 fields to copy: Leave empty (all fields will be copied)
Join type: Take attributes of the first matching feature only (one-to-one)
Leave output as Model Output
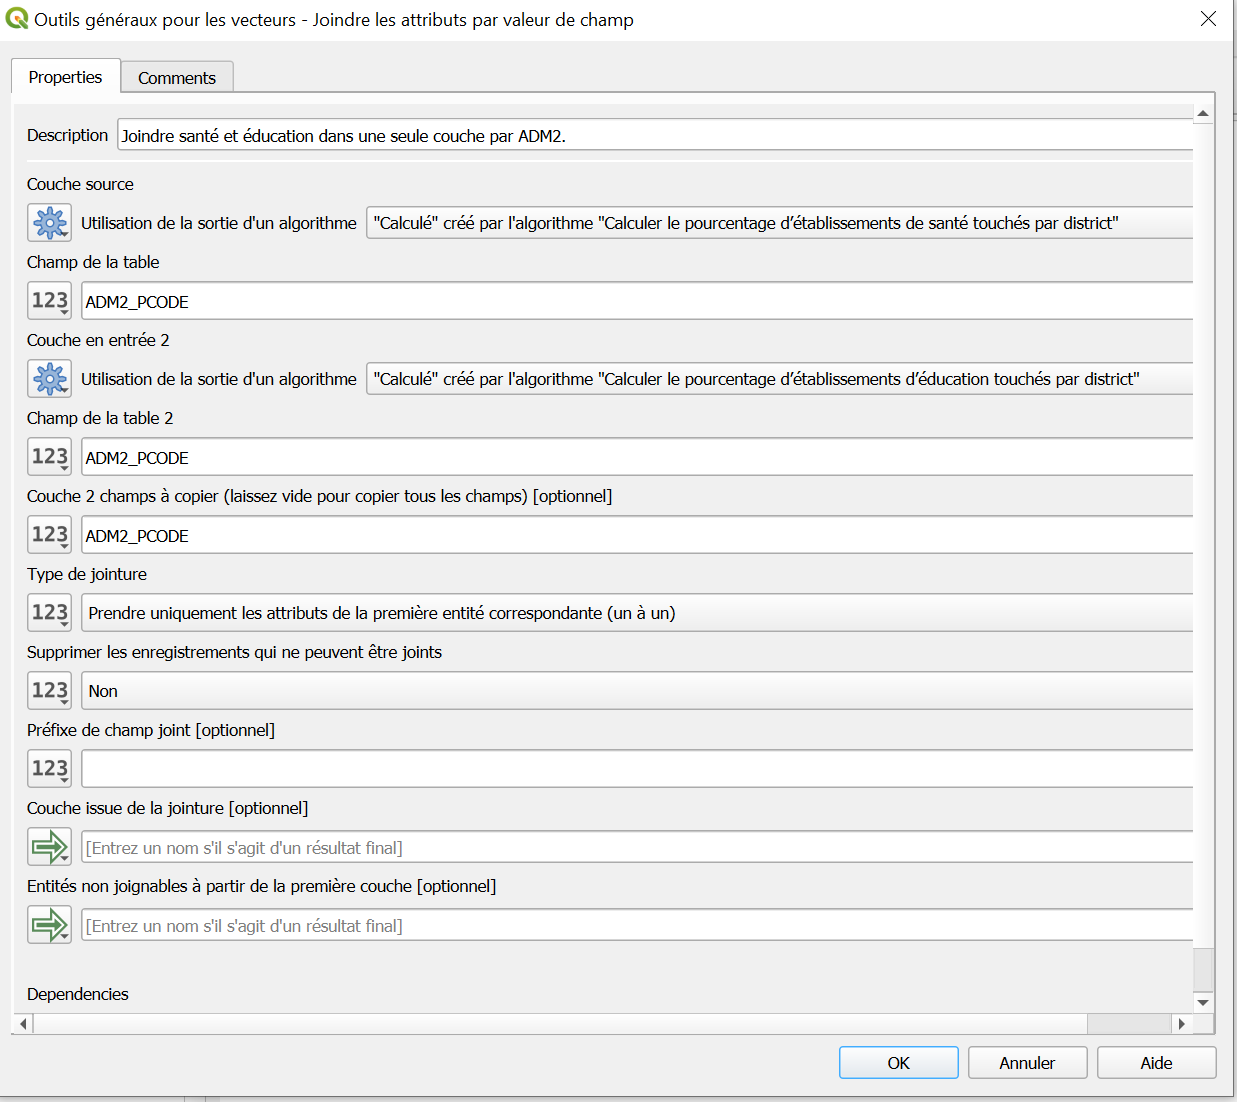
Configuration de l’opération : joindre les données de santé et d’éducation par le champ ADM2_PCODE afin de combiner les résultats dans une seule couche.#
Join the result with the population data Now join the result of the previous step (health + education) to the exposed population data.
Add a second
Join Attributes by Field Valuealgorithm to the modelAdd a description:
Joindre les données de population avec les indicateurs santé et éducationConfigure the algorithm as follows:
Input Layer:
exposed_population(select from Algorithm Output of the Zonal Statistics step)Input Layer 2: Output from Step 2 (health + education)
Table field:
ADM2_PCODETable field 2:
ADM2_PCODELayer 2 fields to copy: (Enter the following field names exactly as shown — comma-separated, no spaces)
count_health_total;sum_exposed_health;pct_exposed_health;count_education_total;sum_exposed_education;pct_exposed_education
Join type: Take attributes of the first matching feature only (one-to-one)
Leave output as Model Output
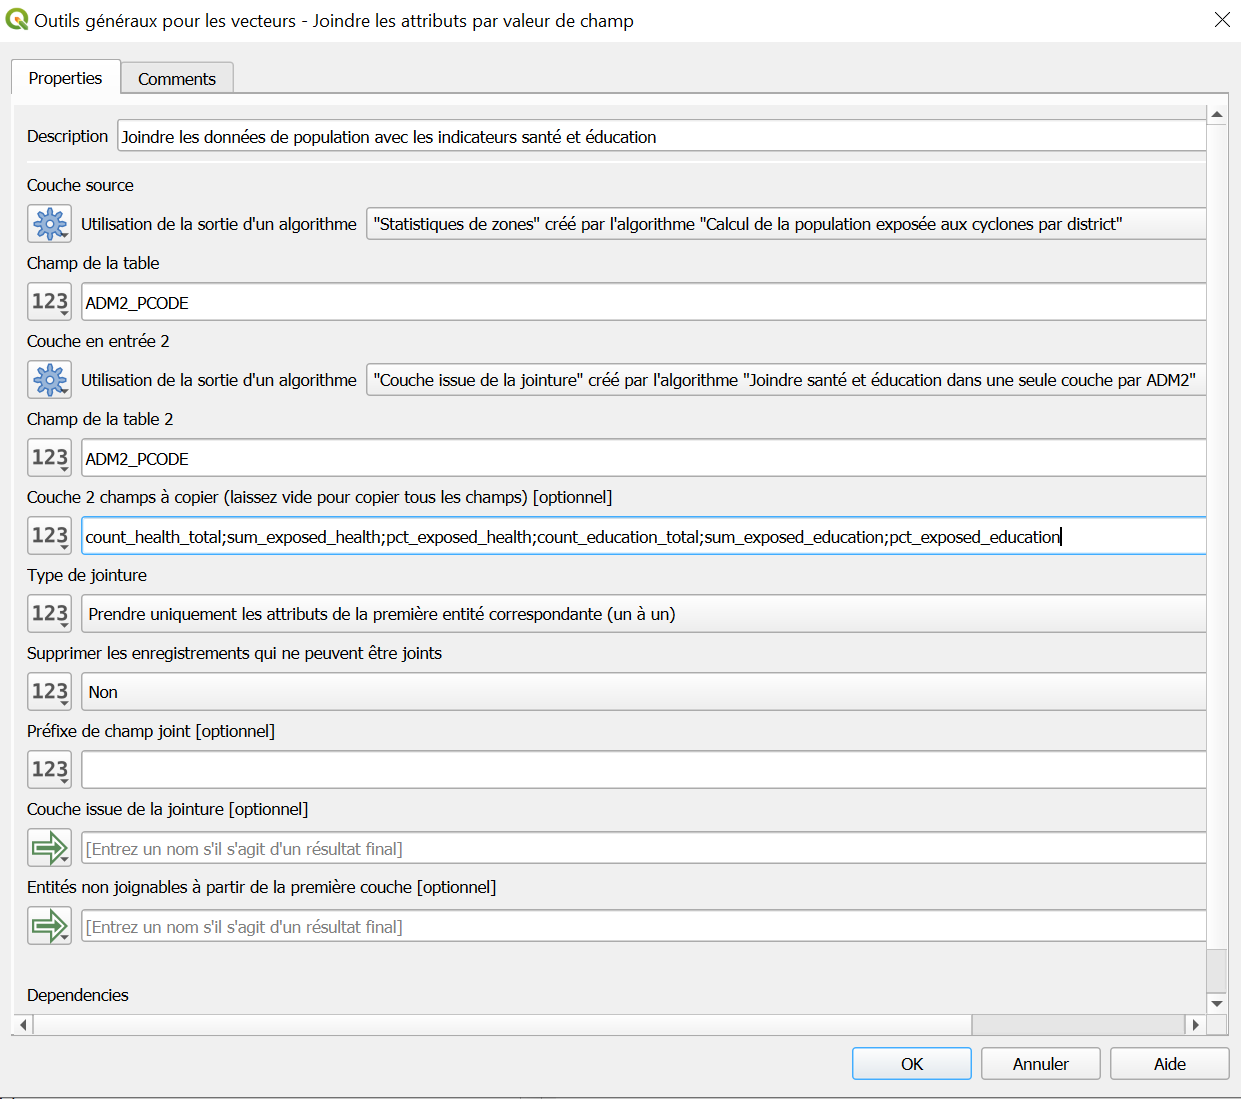
Configuration de l’opération : joindre les données de population avec les indicateurs de santé et d’éducation.#
Tip
Where to find the column names
Open the attribute tables of the outputs health_total_per_admin2, sum_exposed_healthsites_POI, and admin2_health_affected_pct in QGIS.
Look at the column headers to find the exact names of the fields you want to copy.
Warning
Invisible spaces will break the join
If a column name like count_health_total has an invisible trailing space, the join will silently fail.
Always copy field names directly from the attribute table to avoid errors.
Export results to a spreadsheet
In the Processing Toolbox, search for
Export to spreadsheetand double-click to open.Add a description:
Exporter les données de population, d'éducation et de santé dans un seul tableauConfigure the tool as follows:
Input Layer: Select the output of Step 3 from Algorithm Output
Destination spreadsheet:
exposure_indicators_spreadsheetClick
OKto add it to the model. Once you run the model, this step will automatically generate a spreadsheet with all relevant indicators ready for the operations team!
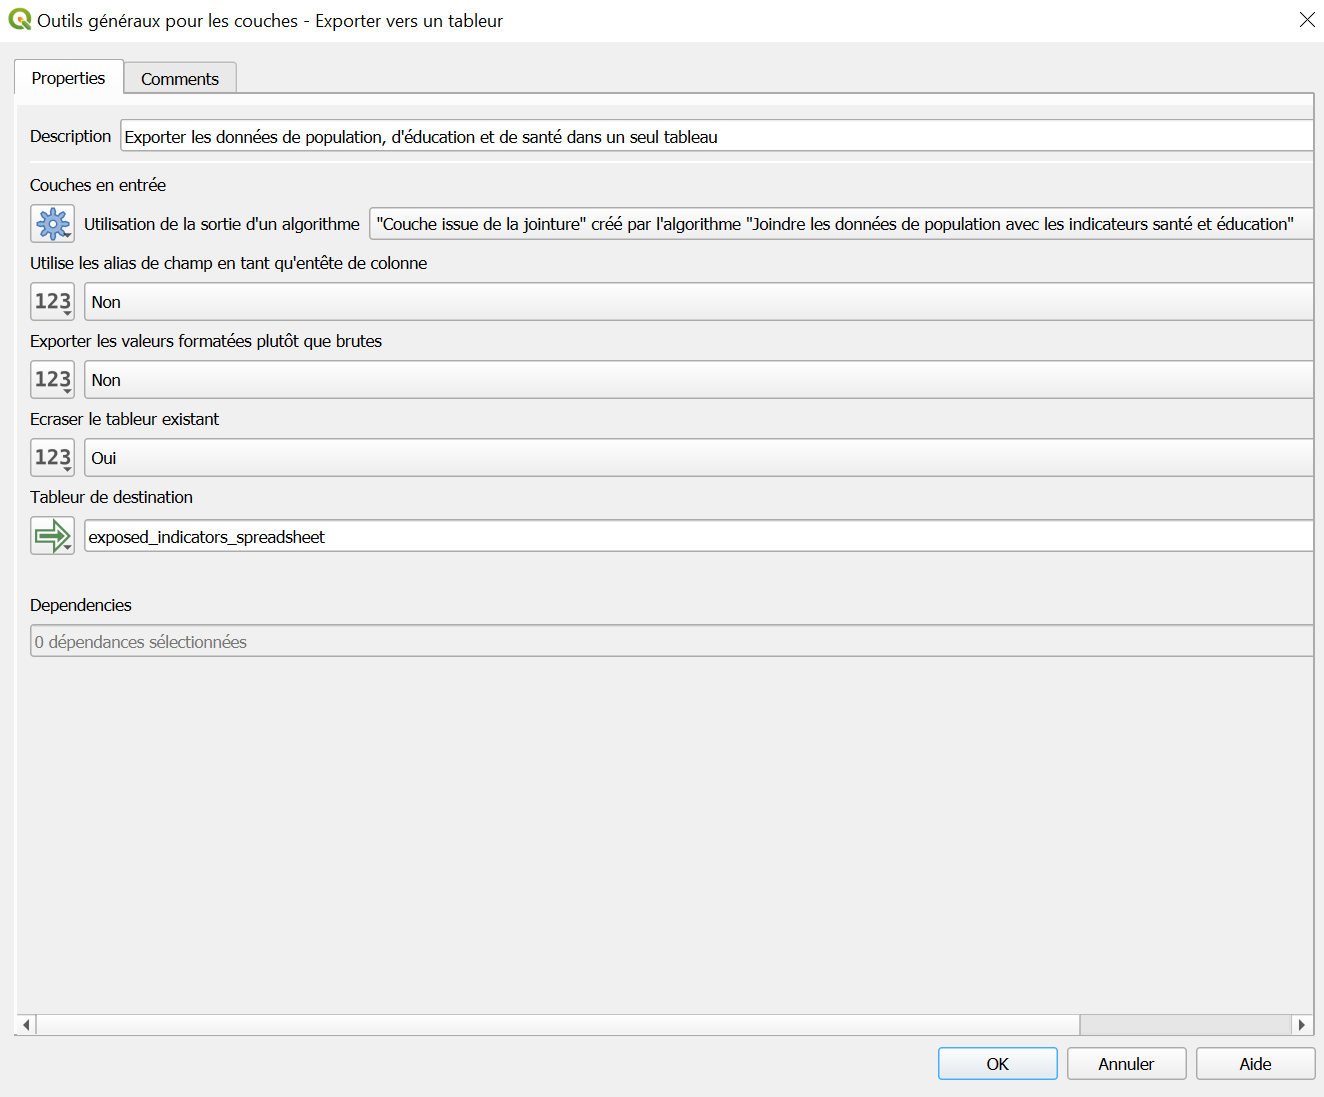
Exporter tous les indicateurs (population, santé, éducation) vers un tableau unique au format tableur.#
Validate and Save Your Extended Model
Click the ✔️ Validate Model button to check for errors.
Save again to:
Estimate_Exposed_Population_Health_Education.model3
Run the model
Click the ▶️ Run button in the top-right corner of the Graphical Modeler window.
Input:
Click on the three dots for each input dataset and select the correct input:
Cyclone Track→ select the GeoJSON of the storm path (e.g.Harald_2025_Track.geojson)Population Raster→ select the WorldPop raster fileAdmin Boundaries→ select the Admin 2 layer (e.g.MDG_adm2.gpkg)Health Facilities→ select the point dataset for health sitesEducation Facilities→ select the point dataset for schools
Output:
Save all output layers in the output folder and use the names below.
admin2_health_affacted->
admin2_health_affectedadmin2_education_affected->
admin2_education_affectedcyclone_harald_buffer->
cyclone_harald_bufferexposed_population_sum->
admin2_harald_Exposed_Populationexposure_indicators_spreadsheet->
exposure_indicators_harald
Click
Runto execute the full model.
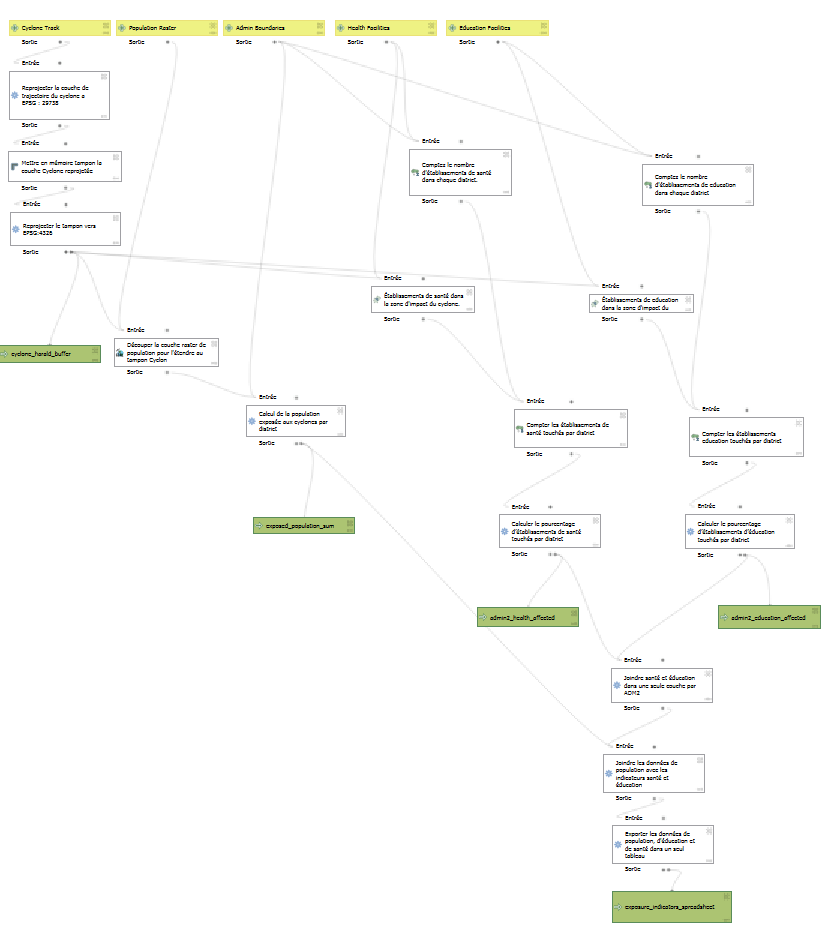
Vue du modeleur graphique avec l’étape d’exportation vers un tableau ajoutée au modèle.#
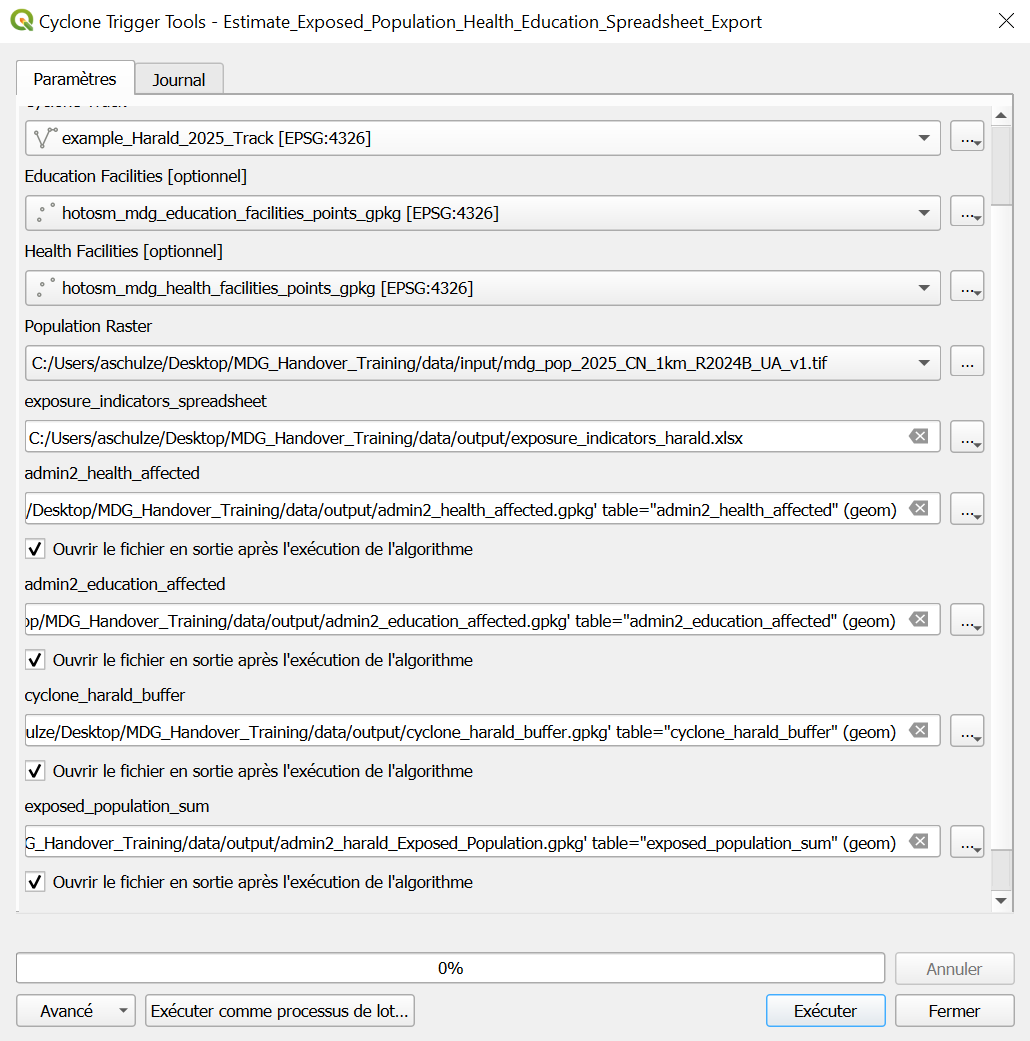
Fenêtre de configuration pour exécuter le modèle avec l’option d’export vers un tableau.#
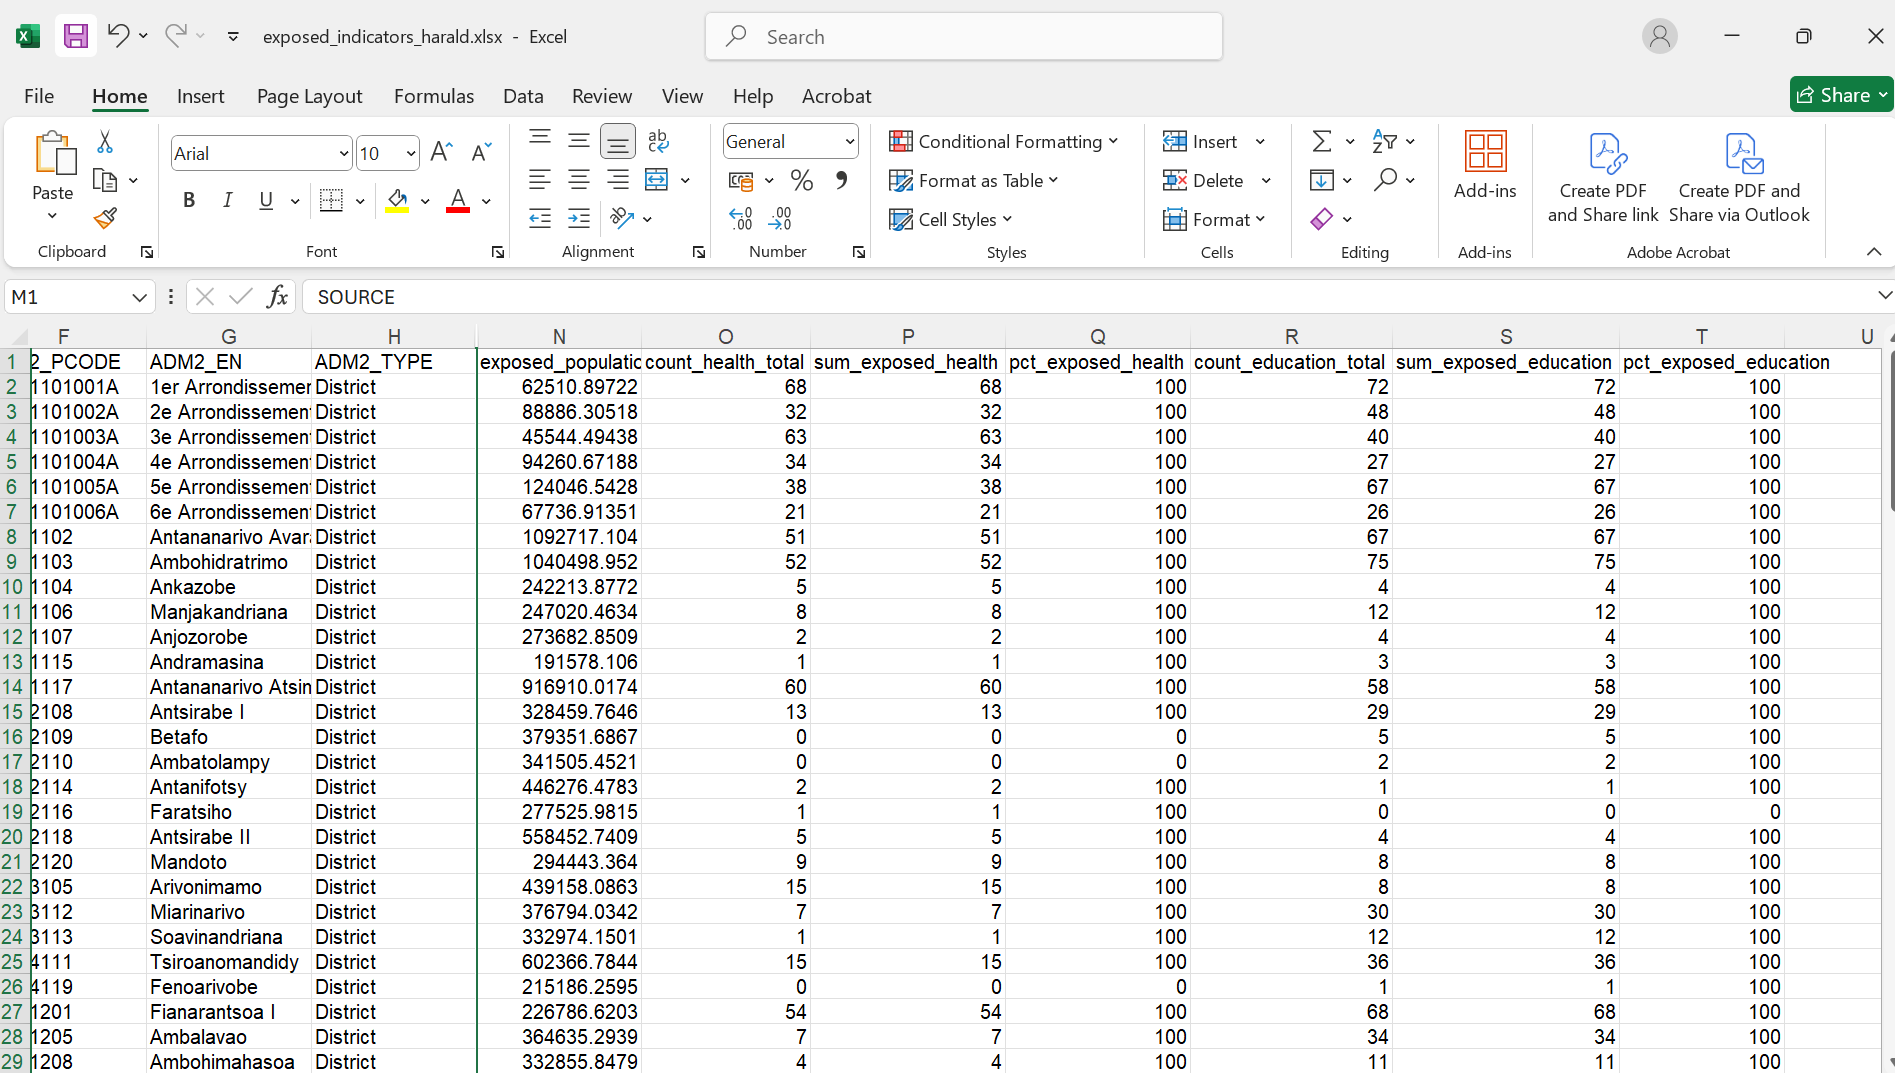
Résultats finaux du modèle exportés dans un tableau prêt à être utilisé.#