Exercise 3: Identifying Affected Health Facilities and Schools – Aina Adds More Layers #
Characteristics of the exercise #
Type of trainings exercise:
This exercise can be used in online and presence training.
It can be done as a follow-along exercise or individually as a self-study.
Exercise Track:
This exercise is part of the Madagascar Anticipatory Action Cyclon Analysis Exercise Track
Estimated time demand for the exercise
Relevant Wiki Articles
Aim of the exercise: Aina, the GIS expert at the Malagasy Red Cross (CRM), is preparing for the upcoming cyclone season. She wants to improve her team’s ability to act quickly once a storm is forecasted by automating key analyses in QGIS. These include estimating exposed populations, identifying impacted services like health and education, and assessing whether health posts can be reached from key warehouses within a critical 10-hour window. The goal is to prepare an end-to-end analysis and visualization workflow that can support fast, data-driven anticipatory action before a cyclone makes landfall.
Instructions for the trainers #
Trainers Corner
Prepare the training
Take the time to familiarise yourself with the exercise and the provided material.
Prepare a white-board. It can be either a physical whiteboard, a flip-chart, or a digital whiteboard (e.g. Miro board) where the participants can add their findings and questions.
Before starting the exercise, make sure everybody has installed QGIS and has downloaded and unzipped the data folder.
Check out How to do trainings? for some general tips on training conduction
Conduct the training
Introduction:
Introduce the idea and aim of the exercise.
Provide the download link and make sure everybody has unzipped the folder before beginning the tasks.
Follow-along:
Show and explain each step yourself at least twice and slow enough so everybody can see what you are doing, and follow along in their own QGIS-project.
Make sure that everybody is following along and doing the steps themselves by periodically asking if anybody needs help or if everybody is still following.
Be open and patient to every question or problem that might come up. Your participants are essentially multitasking by paying attention to your instructions and orienting themselves in their own QGIS-project.
Wrap up:
Leave time for any issues or questions concerning the tasks at the end of the exercise.
Leave some time for open questions.
Available data #
Download all datasets here, save the folder on your computer and unzip the file.
Context #
After building her model to estimate exposed population, Aina wants to expand its usefulness. She decides to also identify critical services affected by cyclones — especially health facilities and schools.
Not only does she want to know which facilities are affected, but also how many in total exist per district. That way, she can calculate the percentage of services affected in each area.
To achieve this, she will use two point datasets from OpenStreetMap:
Tasks: #
Load the health and education facilities datasets First, let’s have a look at the data we want to work with.
Navigate to your
inputdata folder.Drag and drop the following layers into your QGIS project:
hotosm_mdg_health_facilitieshotosm_mdg_education_facilities
Confirm that both layers are visible in the Layers Panel
Save your model under a new name
Open your existing model
Estimate_Exposed_Population.model3.Immediately save it under a new name:
Click
Model→Save As…Save it to the
projectfolder as:
Estimate_Exposed_Population_Health_Education
Add new model inputs
In the Inputs section, add:
Vector LayerDescription:
Health Facilities
Set Geometry Type to
Point
Vector LayerDescription:
Education Facilities
Set Geometry Type to
Point
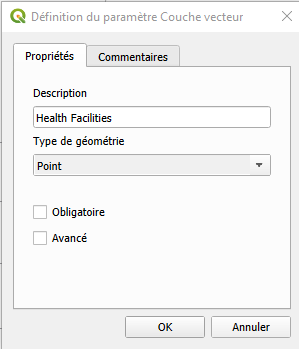
Définir une nouvelle entrée de modèle : couche vectorielle de points représentant les établissements de santé#
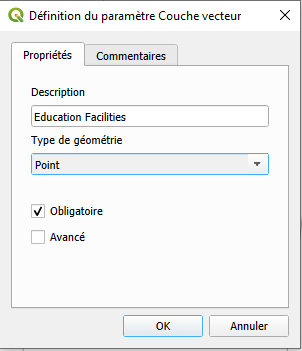
Définir une nouvelle entrée de modèle : couche vectorielle de points représentant les établissements d’éducation#
Count All Health Facilities per Admin 2
From the Algorithms panel, search for Count Points in Polygon.
Configuration:
Add a description:
Comptez le nombre d'établissements de santé dans chaque district.Polygon layer:
Admin Boundaries(Model Input)Points layer:
Health Facilities(Model Input)Count field name:
Count_health_totalLeave output as Model Output
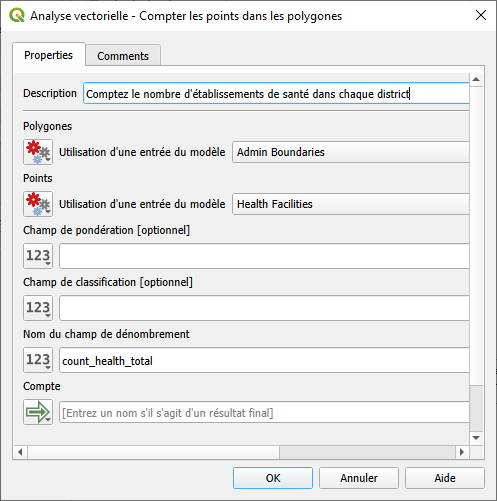
Configuration de l’opération : compter le nombre d’établissements de santé dans chaque district.#
Count All Education Facilities per Admin 2
Add another Count Points in Polygon step.
Configuration:
Add a description:
Comptez le nombre d'établissements de education dans chaque districtPolygon layer:
Admin Boundaries(Model Input)Points layer:
Education Facilities(Model Input)Count field name:
count_education_totalLeave output as Model Output
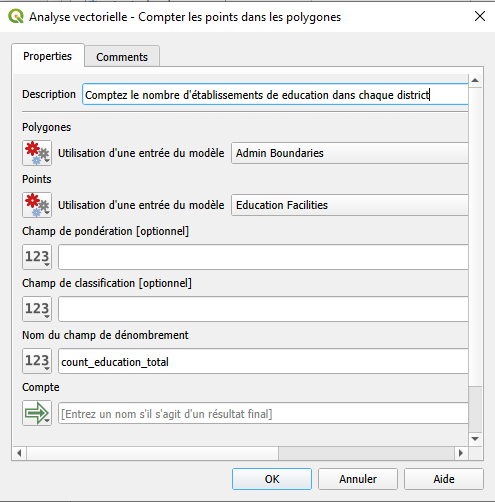
Configuration de l’opération : compter le nombre d’établissements scolaires dans chaque district.#
Intersect Health Facilities with Cyclone Buffer
From the Algorithms panel, search for Intersection.
In the configuration window:
Add a description:
Établissements de santé dans la zone d'impact du cyclone
Input layer:
Health Facilities(Model Input)Overlay layer: buffered cyclone zone (use “Reprojected to EPSG:4326” from Algorithm Output)
Leave output as Model Output
Click OK
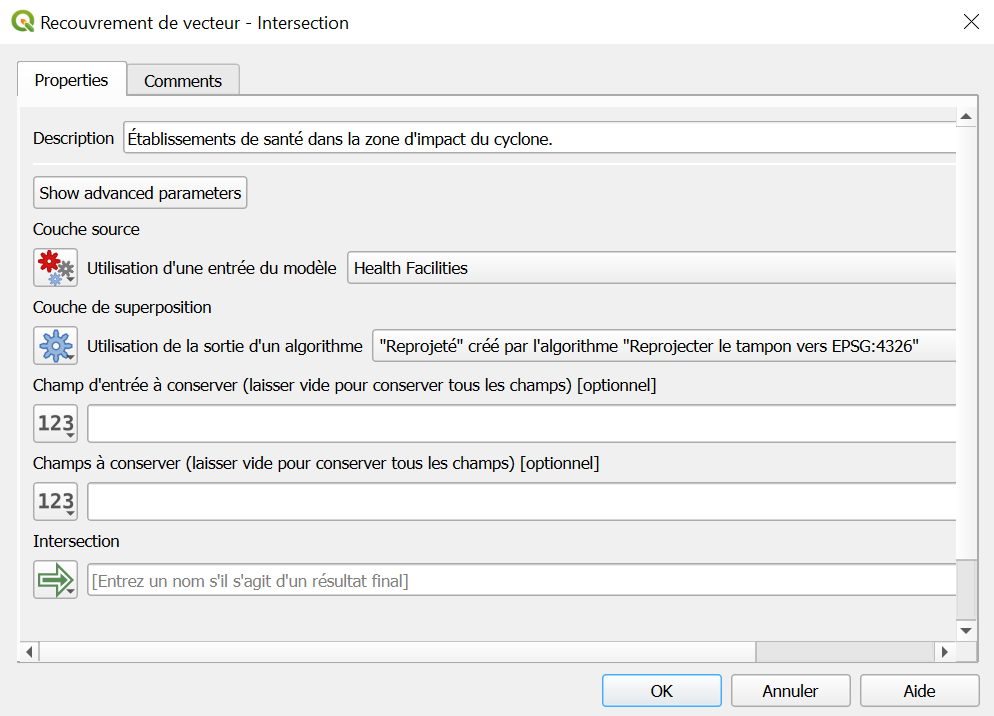
Configuration de l’opération : intersecter les établissements de santé avec la zone d’impact du cyclone.#
Intersect Education Facilities with Cyclone Buffer
Add another Intersection algorithm.
Configuration:
Add a description:
Établissements de education dans la zone d'impact du cyclone.
Input layer:
Education Facilities(Model Input)Overlay layer: buffered cyclone zone (use “Reprojected to EPSG:4326” from Algorithm Output)
Leave output as Model Output
Click
OK.
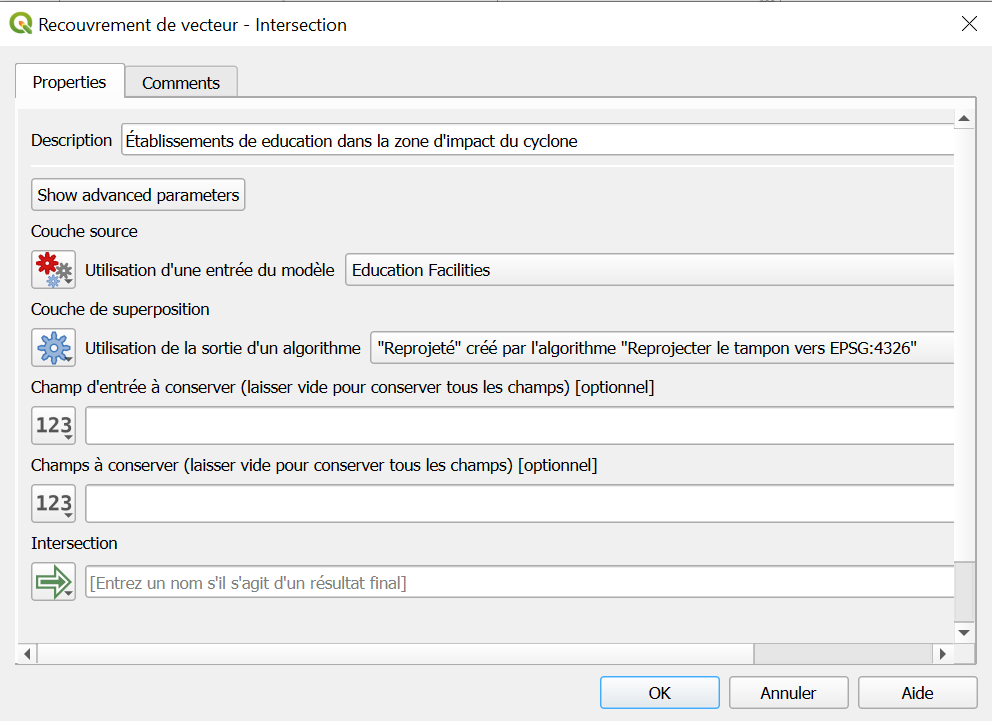
Configuration de l’opération : intersecter les établissements de education avec la zone d’impact du cyclone.#
Count Affected Health Facilities per Admin 2
Add Count Points in Polygon
Add a description:
Compter les établissements de santé touchés par districtConfiguration:
Add a description: Compter les établissements de santé touchés par district
Compter les établissements de santé touchés par district
Polygon layer: Count total health facilities output
Points layer: intersected health facilities output
Count field name:
sum_exposed_health
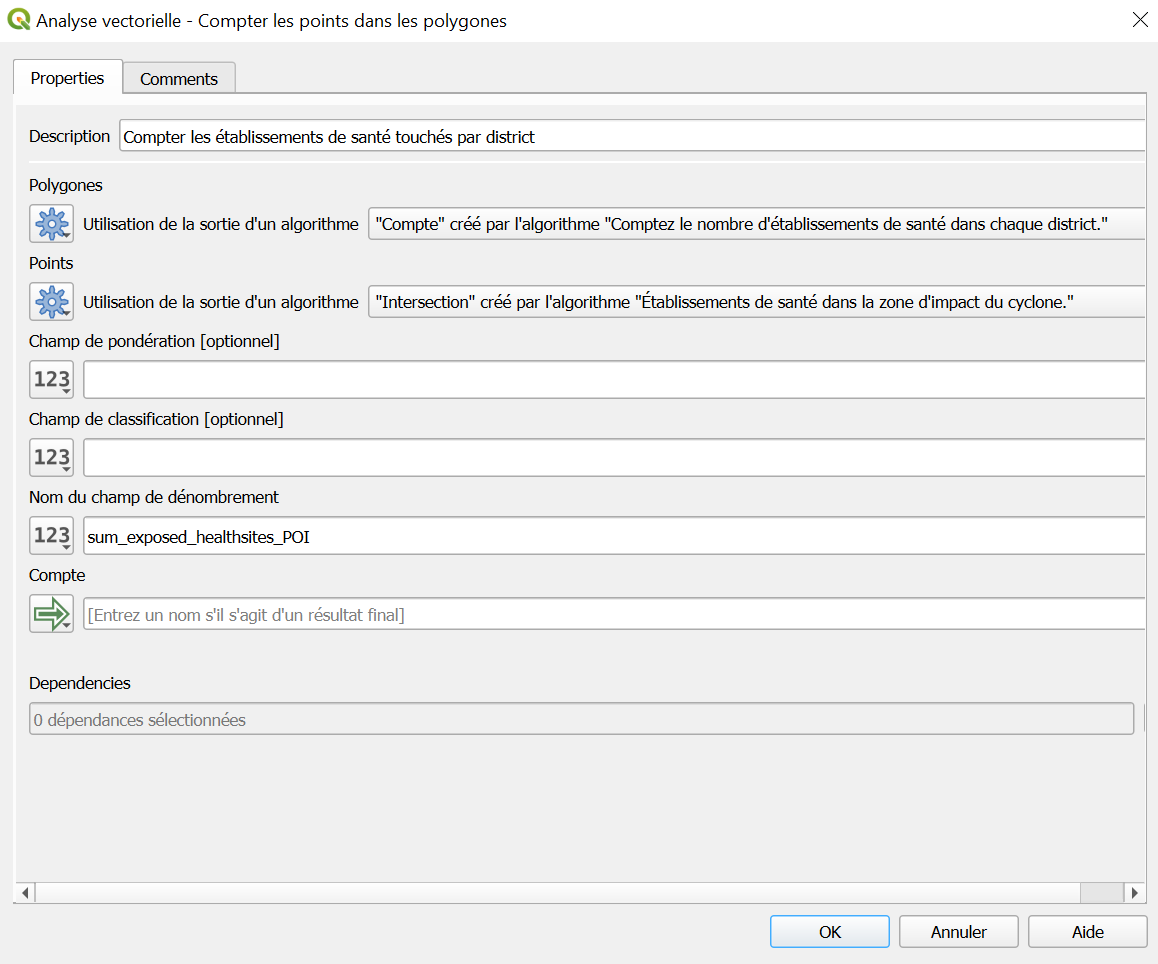
Configuration de l’opération : compter les établissements de santé touchés par district.#
Count Affected Education Facilities per Admin 2
Add Count Points in Polygon
Add a description:
Compter les établissements education touchés par districtConfiguration:
Add a description:
Compter les établissements education touchés par district
Polygon layer: Count total education facilities output
Points layer: intersected education facilities output
Count field name:
sum_exposed_education
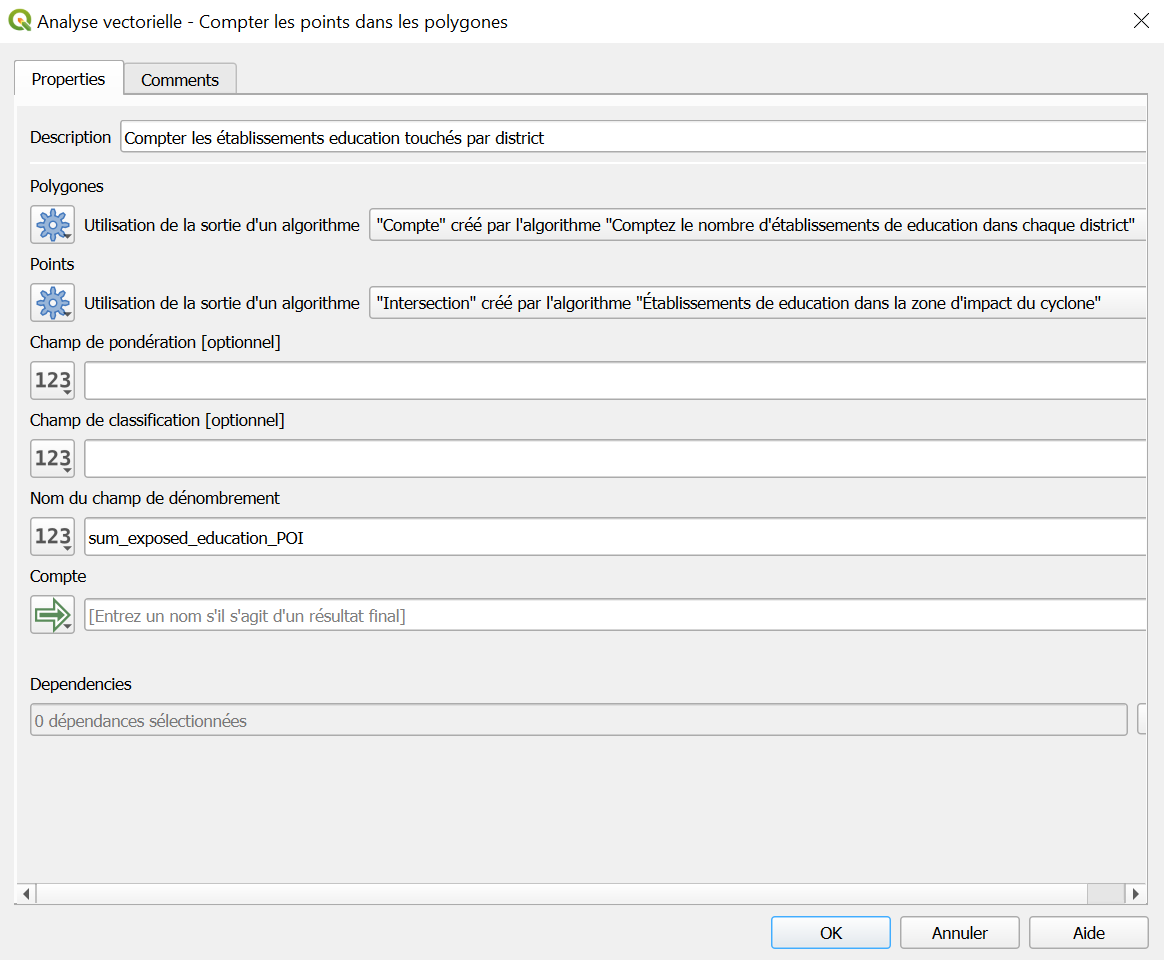
Configuration de l’opération : compter les établissements de santé touchés par district.#
Calculate percentage of affected Health Facilities To compute the percentage of affected health sites per administrative area, we will use the Field Calculator:
Add the Field Calculator:
Add a description:
Calculer le pourcentage d’établissements de santé touchés par districtConfiguration:
Add a description:
Calculer le pourcentage d’établissements de santé touchés par district
Input layer: the output of Count Affected Health Facilities per Admin 2
Output field name:
pct_exposed_healthField type: Decimal (real)
Expression:
 CASE WHEN "count_health_total" > 0
 THEN "sum_exposed_health" / "count_health_total" * 100
 ELSE 0
 END
Set the output as Model Output
Name it:
admin2_health_affected
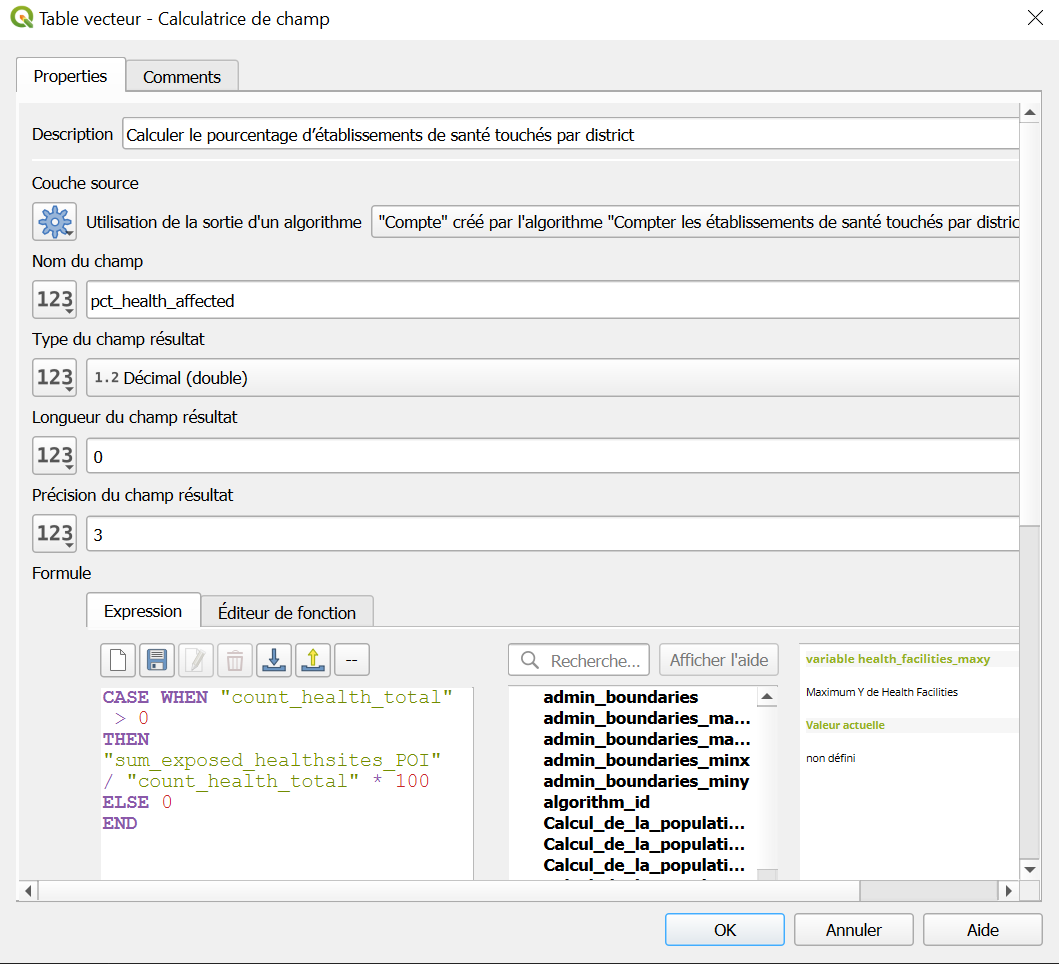
Configuration de l’opération : calculer le pourcentage d’établissements de santé touchés par district.#
Calculate percentage of affected Education Facilities To compute the percentage of affected education sites per administrative area, we will use the Field Calculator:
Add the Field Calculator:
Add a description:
Calculer le pourcentage d’établissements d’éducation touchés par districtConfiguration:
Add a description:
Calculer le pourcentage d’établissements d’éducation touchés par district
Input layer: the output of Count Affected Education Facilities per Admin 2
Output field name:
pct_exposed_educationField type: Decimal (real)
Expression:
CASE WHEN "count_education_total" > 0
THEN "sum_exposed_education_POI" / "count_education_total" * 100
ELSE 0
END
Set the output as Model Output
Name it:
admin2_education_affected
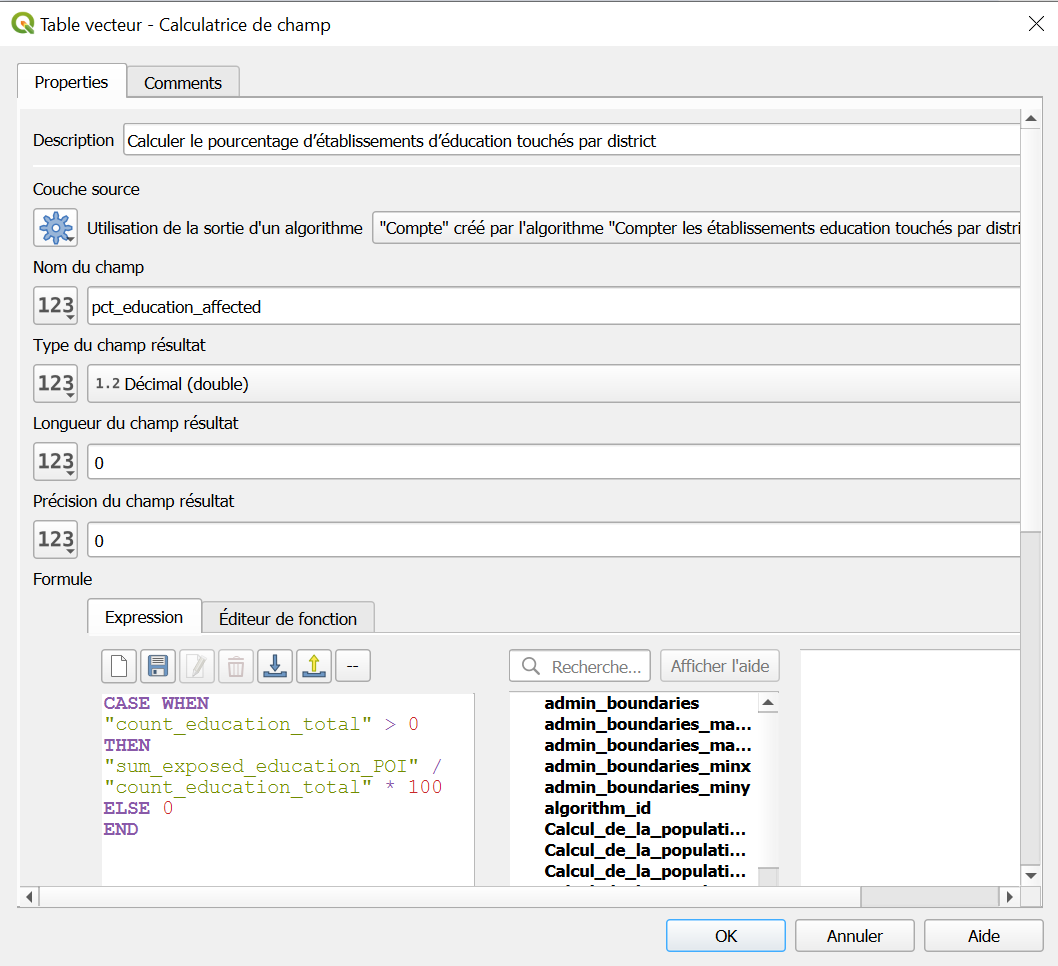
Configuration de l’opération : calculer le pourcentage d’établissements d’éducation touchés par district.#
Validate and Save Your Extended Model
Click the ✔️ Validate Model button to check for errors.
Save again to:
Estimate_Exposed_Population_Health_Education.model3
Run the model
Click the ▶️ Run button in the top-right corner of the Graphical Modeler window.
Input:
Click on the three dots for each input dataset and select the correct input:
Cyclone Track→ select the GeoJSON of the storm path (e.g.Harald_2025_Track.geojson)Population Raster→ select the WorldPop raster fileAdmin Boundaries→ select the Admin 2 layer (e.g.MDG_adm2.gpkg)Health Facilities→ select the point dataset for health sitesEducation Facilities→ select the point dataset for schools
Output:
Save all output layers in the output folder and use the names below.
admin2_health_affacted->
admin2_health_affectedadmin2_education_affected->
admin2_education_affectedcyclone_harald_buffer->
cyclone_harald_bufferexposed_population_sum->
admin2_harald_Exposed_Population
Click
Runto execute the full model.
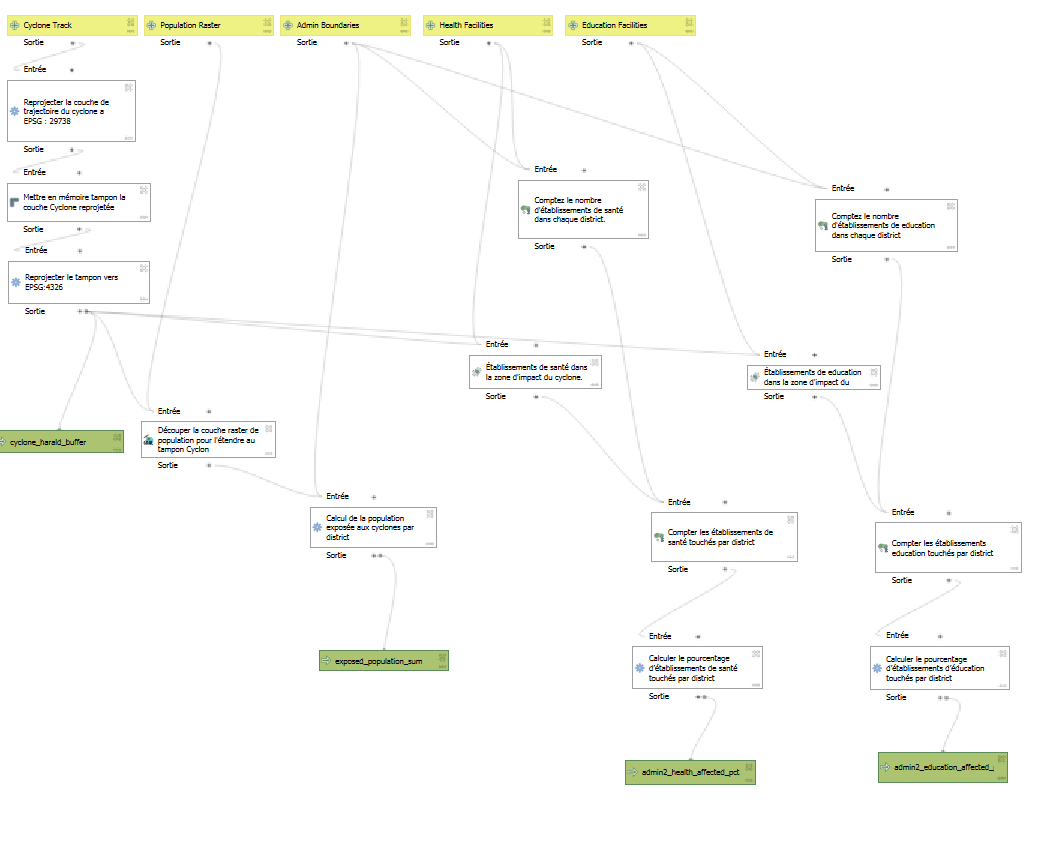
Vue d’ensemble du Modèle Graphique de la tâche 3 montrant tous les algorithmes connectés et les sorties définies.#

Configuration des paramètres pour exécuter le modèle de la tâche 3 avec toutes les couches d’entrée requises.#

Résultats du modèle de la tâche 3 affichés dans QGIS, y compris les pourcentages d’établissements de santé et d’éducation touchés par district.#