Exercise 5: The world #
Characteristics of the exercise #
Aim of the exercise:
This exercise will help you to get to know the interface of QGIS a bit better. Furthermore, you will load your first data in QGIS and gain some hands-on experience with the layer concept and learn how to reproject layers.
Type of trainings exercise:
This exercise can be used in online and presence training.
It can be done as a follow-along exercise or individually as a self-study.
Competences covered in this exercise:
Creating and saving a new QGIS project
Importing vector data (
.shpand.gpkg) as well as tabular data (.txt)Understanding the layer concept
Navigating the QGIS interface and map canvas
Estimated time demand for the exercise
The exercise takes around 30 minutes to complete, depending on the number of participants and trainers.
Relevant Wiki Articles
Instructions for the trainers #
Trainers Corner
Prepare the training
Take the time to familiarise yourself with the exercise and the provided material.
Prepare a white-board. It can be either a physical whiteboard, a flip-chart, or a digital whiteboard (e.g. Miro board) where the participants can add their findings and questions.
Before starting the exercise, make sure everybody has installed QGIS and has downloaded and unzipped the data folder.
Check out How to do trainings? for some general tips on training conduction
Conduct the training
Introduction:
Introduce the idea and aim of the exercise.
Provide the download link and make sure everybody has unzipped the folder before beginning the tasks.
Follow-along:
Show and explain each step yourself at least twice and slow enough so everybody can see what you are doing, and follow along in their own QGIS-project.
Make sure that everybody is following along and doing the steps themselves by periodically asking if anybody needs help or if everybody is still following.
Be open and patient to every question or problem that might come up. Your participants are essentially multitasking by paying attention to your instructions and orienting themselves in their own QGIS-project.
Wrap up:
Leave time for any issues or questions concerning the tasks at the end of the exercise.
Leave some time for open questions.
Available Data #
Download all datasets here, save the folder on your computer and unzip the file.
The folder is called “Module_2_Exercise_5_The_World” and contains the whole standard folder structure with all data in the input folder and the additional documentation in the documentation folder.
World Countries (Generalized) (Polygon/Shapefile)
Global Power Plant Dataset (Points/GeoPackage)
Tasks #
Open QGIS and create a new project by clicking on
Project→NewOnce the project is created save the project in the
/Project-subfolder in the/Module_2_Exercise_5_The_World/. In the top bar, click onProject→Save asand navigate to the folder. Name the project “Module_2_Ex_5_The_World”.Load the shape file
World_countries_generalized.shpinto your project by drag and drop (Wiki Video). Or click onLayer→Add Layer→Add Vector Layer. Click on the three points and navigate to “World_countries__generalized”. Select the file and click
 Open. Back in QGIS clickAdd(Wiki Video).Attention
With both methods, you need to select the file with the ending
.shp! A shapefile consists of several files that are referring to each other. The file that holds the geometry information is the file ending with.shp.Load the GeoPackage file
global_power_plant_database_nuclear.gpkginto the QGIS project. You can use one of the methods used in the previous step: Either drag and drop (Wiki Video) the file or click onLayer→Add Layer→Add Vector Layer. Click on the three points and navigate to /data/input/. Select the file and clickOpen. Back in QGIS clickAdd(Wiki Video).Note
GeoPackage files can contain multiple files, and even whole QGIS projects. When you load such a file in QGIS, a window will appear in which you have to select the files you want to load in your QGIS project.
Next, we want to load the file
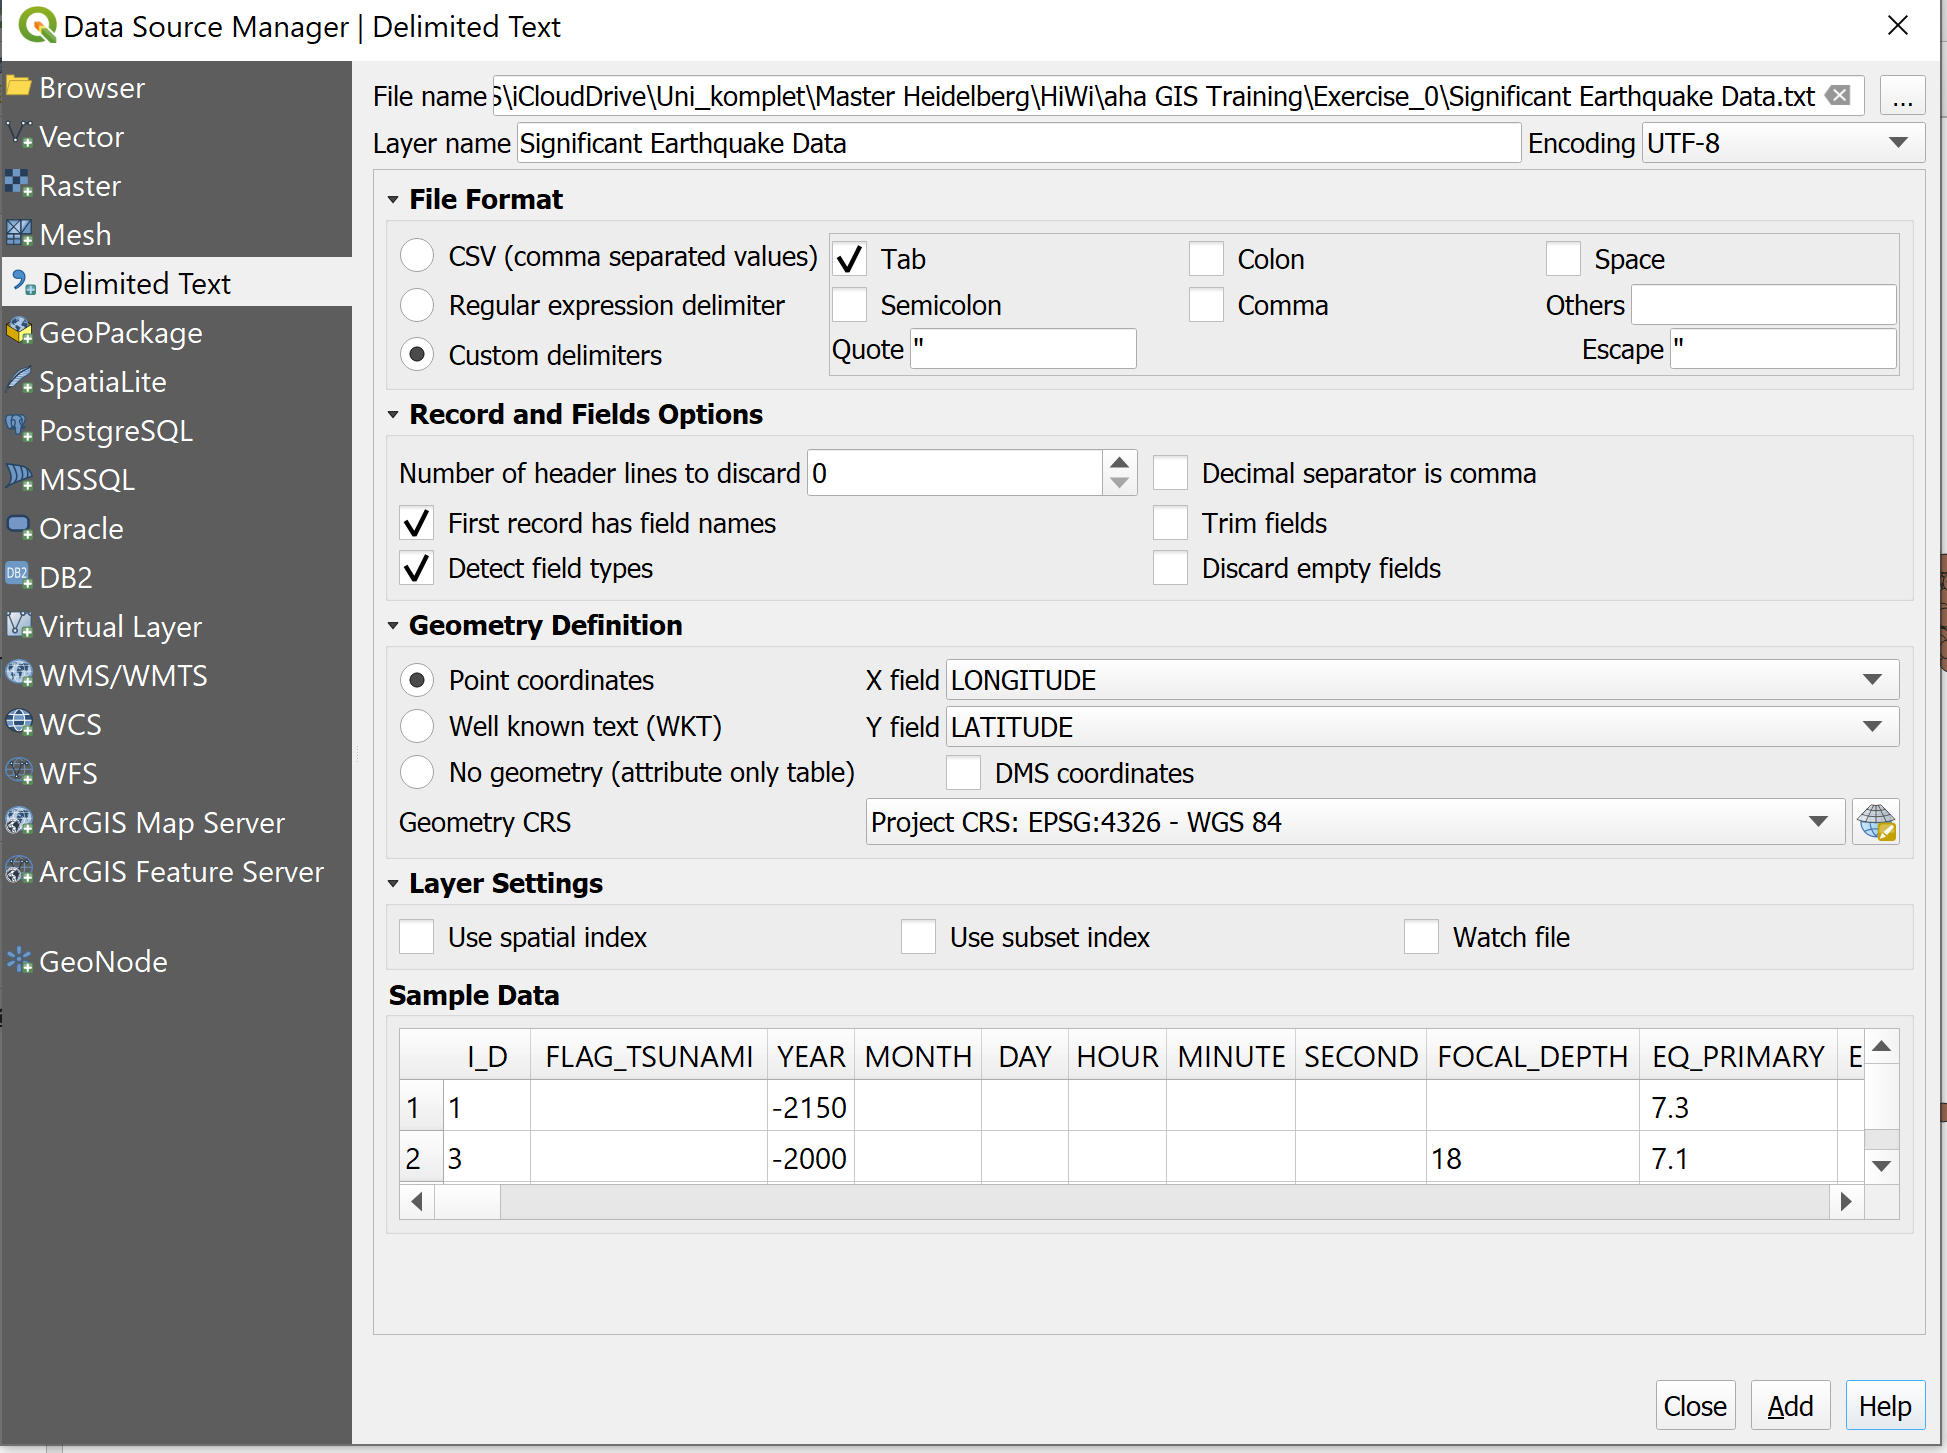
Significant_earthquake_data.txtinto QGIS. Since this is vector data in text format, we need to follow specific steps (Wiki Video).Click on
Layer→Add Layer→Add Delimited text Layer. Click on the three points and navigate to Significant_earthquake_data.txtin thedata/input/-subfolder. Select the file and clickOpen.In the window “Data Source manager| Delimited Text” in QGIS open the dropdown menu
File Formatand checkCustom delimiterandTab.Open the dropdown menu
Geometry definition. Make sure the optionPoint coordinatesis checked. Furthermore, select forX field“LONGITUDE” and forY field“LATITUDE”.Select the coordinate reference system (CRS) “EPSG:4326-WGS 84”.
Click
Add.
Note
When loading vector data in text format like .csv or .txt in QGIS, these data has to have latitude and longitude columns.
X field=“LONGITUDE”Y field= “LATITUDE”.
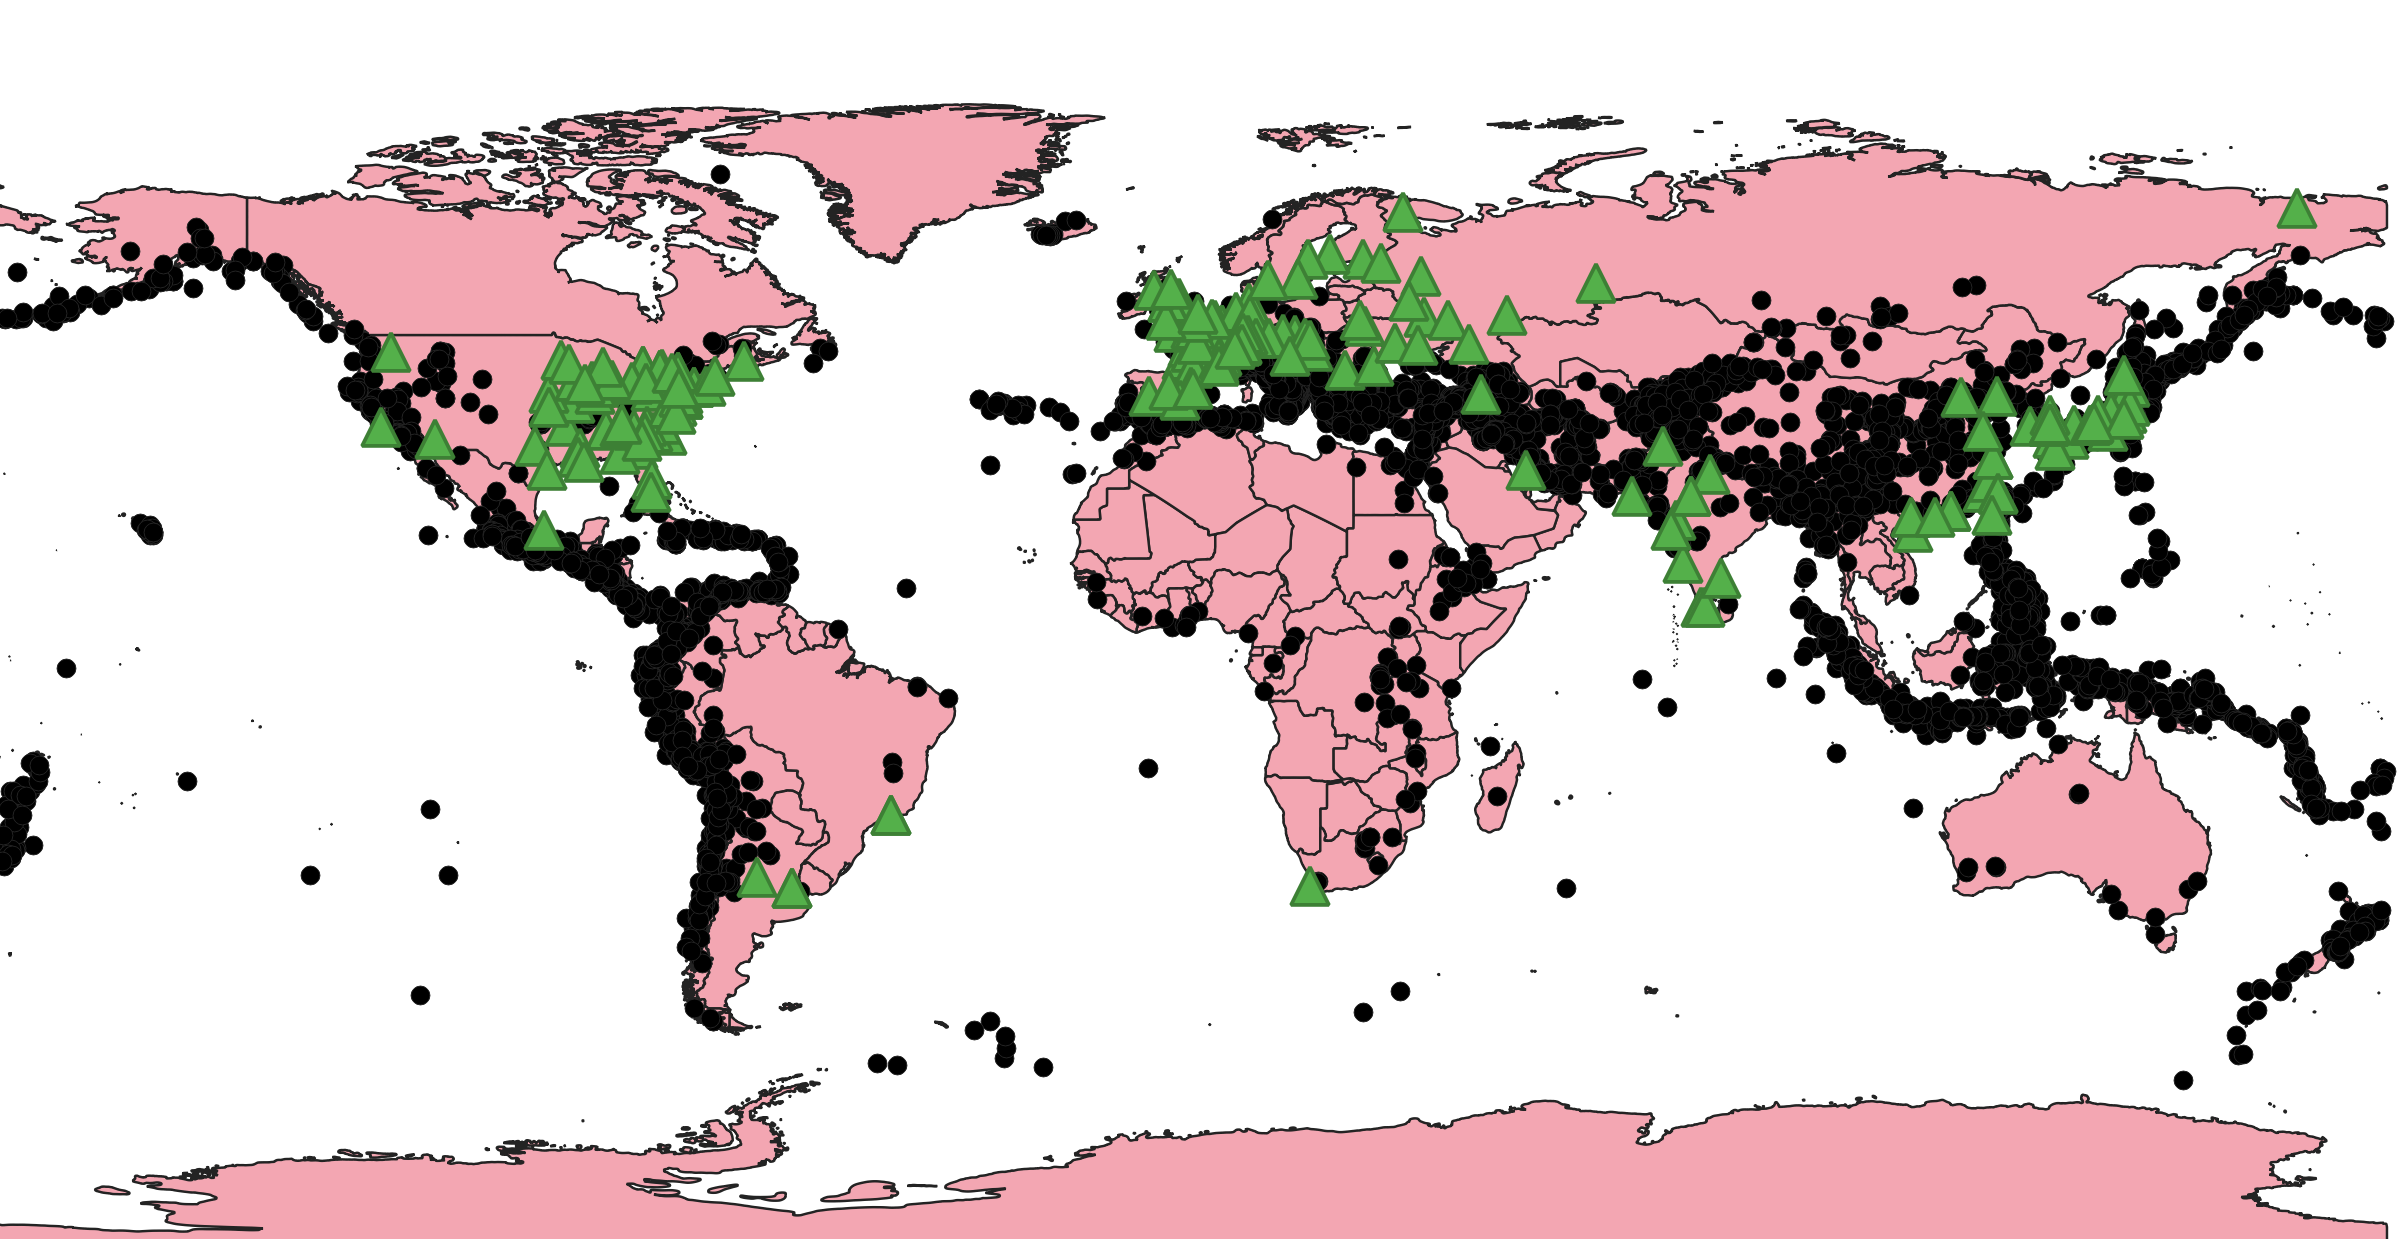
In the layer panel on the left, arrange the three layers in a practical order. Remember the Layer Concept. The countries-layer should sit below the earthquake and power plant layers.
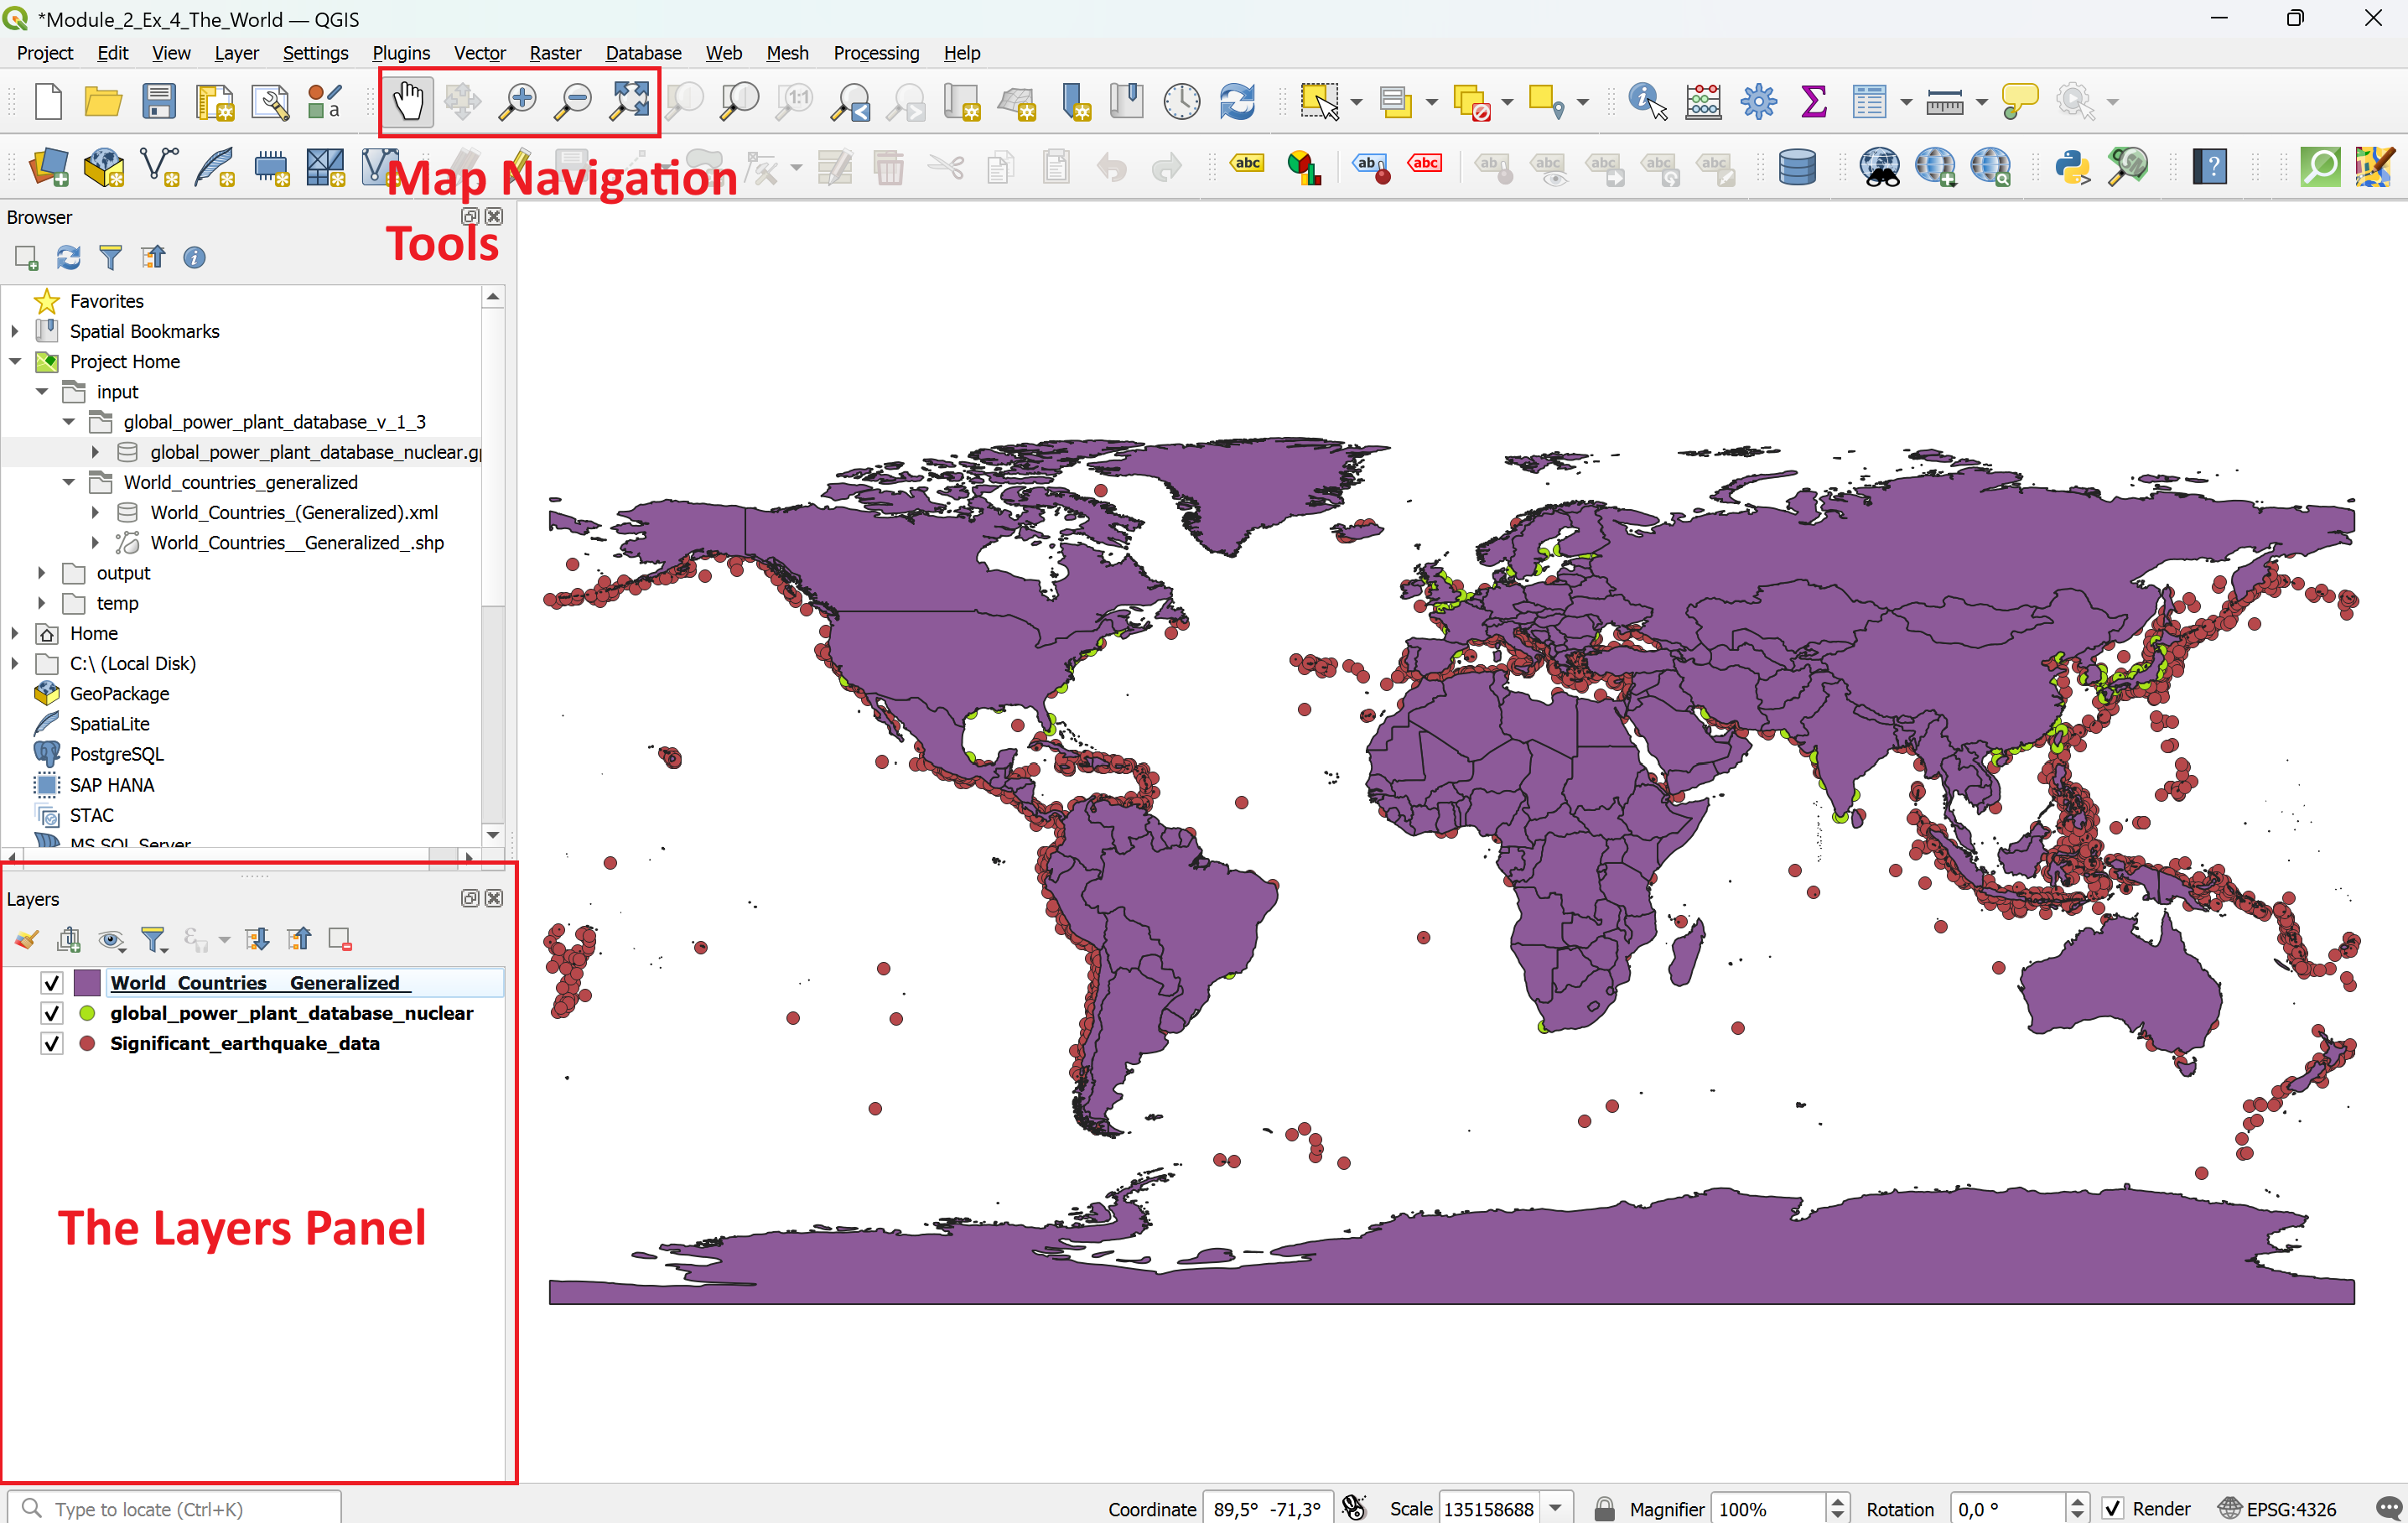
Interact with the map and explore the data sets. Use the zoom tool and move the map. Where can you find a lot of earthquakes and where are most of the power plants located?
Save your project by clicking on the
 or use the hotkey combination Ctrl + S.
Your results should look something like this: