Exercise 5: Larkana Flood response #
Larkana flood response exercise track:
This exercise is the third exercise in the Larkana flood response exercise track.
Competences covered in this exercise
Select features and export to new file
Extract by Location
Reproject Layer
Editing the Attribute Table
Classification
Digitising a point Layer
Estimated time demand for the exercise
The exercise takes around 3 hours to complete, depending on the number of participants and their familiarity with computer systems.
Relevant wiki articles and module chapters
Instructions for the trainers #
Trainers Corner
Prepare the training
Take the time to familiarise yourself with the exercise and the provided material.
Prepare a white-board. It can be either a physical whiteboard, a flip-chart, or a digital whiteboard (e.g. Miro board) where the participants can add their findings and questions.
Before starting the exercise, make sure everybody has installed QGIS and has downloaded and unzipped the data folder.
Check out How to do trainings? for some general tips on facilitating trainings.
Conduct the training
Introduction:
Introduce the idea and aim of the exercise.
Provide the download link and make sure everybody has unzipped the folder before beginning the tasks.
Follow-along:
Show and explain each step yourself at least twice and slow enough so everybody can see what you are doing, and follow along in their own QGIS-project.
Make sure that everybody is following along and doing the steps themselves by periodically asking if anybody needs help or if everybody is still following.
Be open and patient to every question or problem that might come up. Your participants are essentially multitasking by paying attention to your instructions and orienting themselves in their own QGIS-project.
Wrap up:
Leave time for any issues or questions concerning the tasks at the end of the exercise.
Leave some time for open questions.
Available Data #
Download all datasets here and save the folder on your computer and unzip the file.
Dataset |
Original title |
Publisher |
Downloaded from |
|---|---|---|---|
PAK_Sindh_adm1.gpkg |
UN OCHA |
HDX |
|
PAK_Sindh_adm2.gpkg |
UN OCHA |
HDX |
|
PAK_Sind_Health_Facilities.gpkg |
Humanitarian OpenStreetMap Team (HOT) |
HDX |
|
VIIRS_20240721_20240803_MinimumFloodExtent_PAK.shp |
Satellite detected water extents from 08 to 12 August 2024 over Pakistan) |
UNO SAT |
HDX |
Roads_Larkana.gpkg |
Humanitarian OpenStreetMap Team |
HOT Export Tool (Export created in September 2024) |
Hint
Reprojected and fixed Flood extend layer can be downloaded here
Hint
Folder structure To keep your data organized and easily accessible, it’s important to establish a clear folder structure on your computer for your QGIS projects and geodata. Ensure that your exercise data are saved in a location that allows for easy retrieval and association with the corresponding QGIS project.
Task 1: Gain an overview of the situation around Larkana #
Context
You have been deployed as an information manager to the flood-affected regions of Pakistan. Upon your arrival you received reports from the operations team indicating that the city of Larkana and its surrounding areas have been severely affected by the floods. The team needs a general overview of the location of the city.
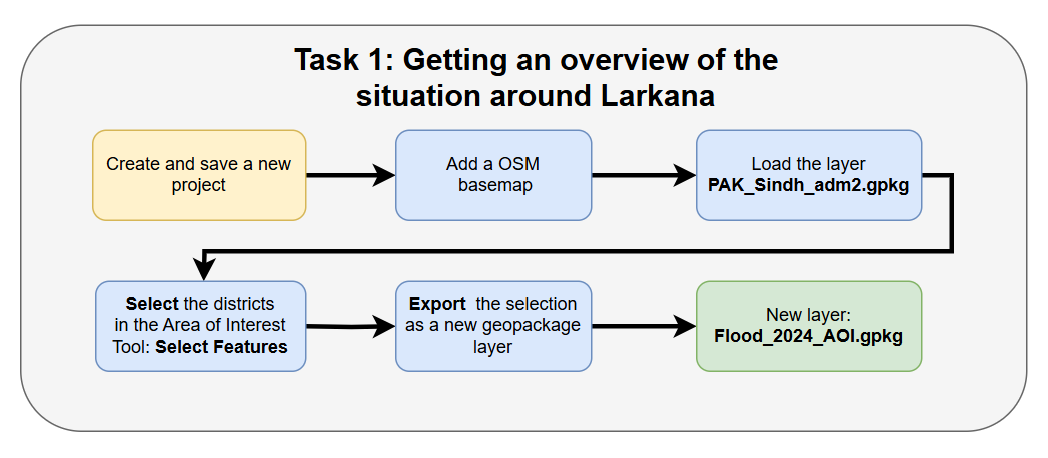
Open QGIS and create a new project by clicking on
Project→New.Once the project is created save the project in the folder of the exercise “Module_3_Exercise_2_Flood_Larkana”. To do that click on
Project→Save asand navigate to the folder. Name the project “PAK_Larkana_flood_2024”.First, we want to add the OpenStreetMap as a base map for orientation. To add the OSM as a base map click on
Layer→Add Layer→Add XYZ Layer…. ChooseOpenStreetMapand clickAdd.Next, load the GeoPackage “PAK_Sindh_adm2.gpkg” in your project by drag and drop (Wiki Video). Or click on
Layer→Add Layer→Add Vector Layer. Click on the three points and navigate to “PAK_Sindh_adm2.gpkg”. Select the file and click
 Open. Back in QGIS clickAdd(Wiki Video).
Attention
GeoPackage files can contain multiple files and even entire QGIS projects. When you load such a file in QGIS a window will appear in which you have to select the files you want to load in your QGIS project.
To get an overview of the situation, we want to export the administrative boundaries for our Area of Interest (AOI). To do this, we want to export the district Larkana, as well as the neighbouring districts from the
PAK_adm2_Sindh-layer.Right-Click on the
PAK_adm2_Sindh-layer and select Open Attribute table.Find the the column
ADM2_ENand find the row for the district of Larkana.Click on the numbers all the way to the left of the attribute table window to select the Larkana feature. The row will appear blue and the area of Larkana will turn yellow on the map canvas.
Click on
Zoom Map to selected rowsin the top bar of the attribute table window. .
.Close the attribute table.
In the toolbar at the top of the QGIS-window, select the tool
Select Feature(s) . Hold Ctrl and Click on the districts that are surrounding the district of Larkana (Wiki Video). The six selected districts should appear yellow on your map canvas.
Deactivate the
Select Feature(s)-tool by clicking on the icon in the toolbar at the top of your QGIS-window.
We can now export the selected features and save them to a new file. Right click on the
PAK_adm2_Sindhlayer and selectExport→Save Selected Features as.A new window will open. Here, you can select how and where the selected features are saved.
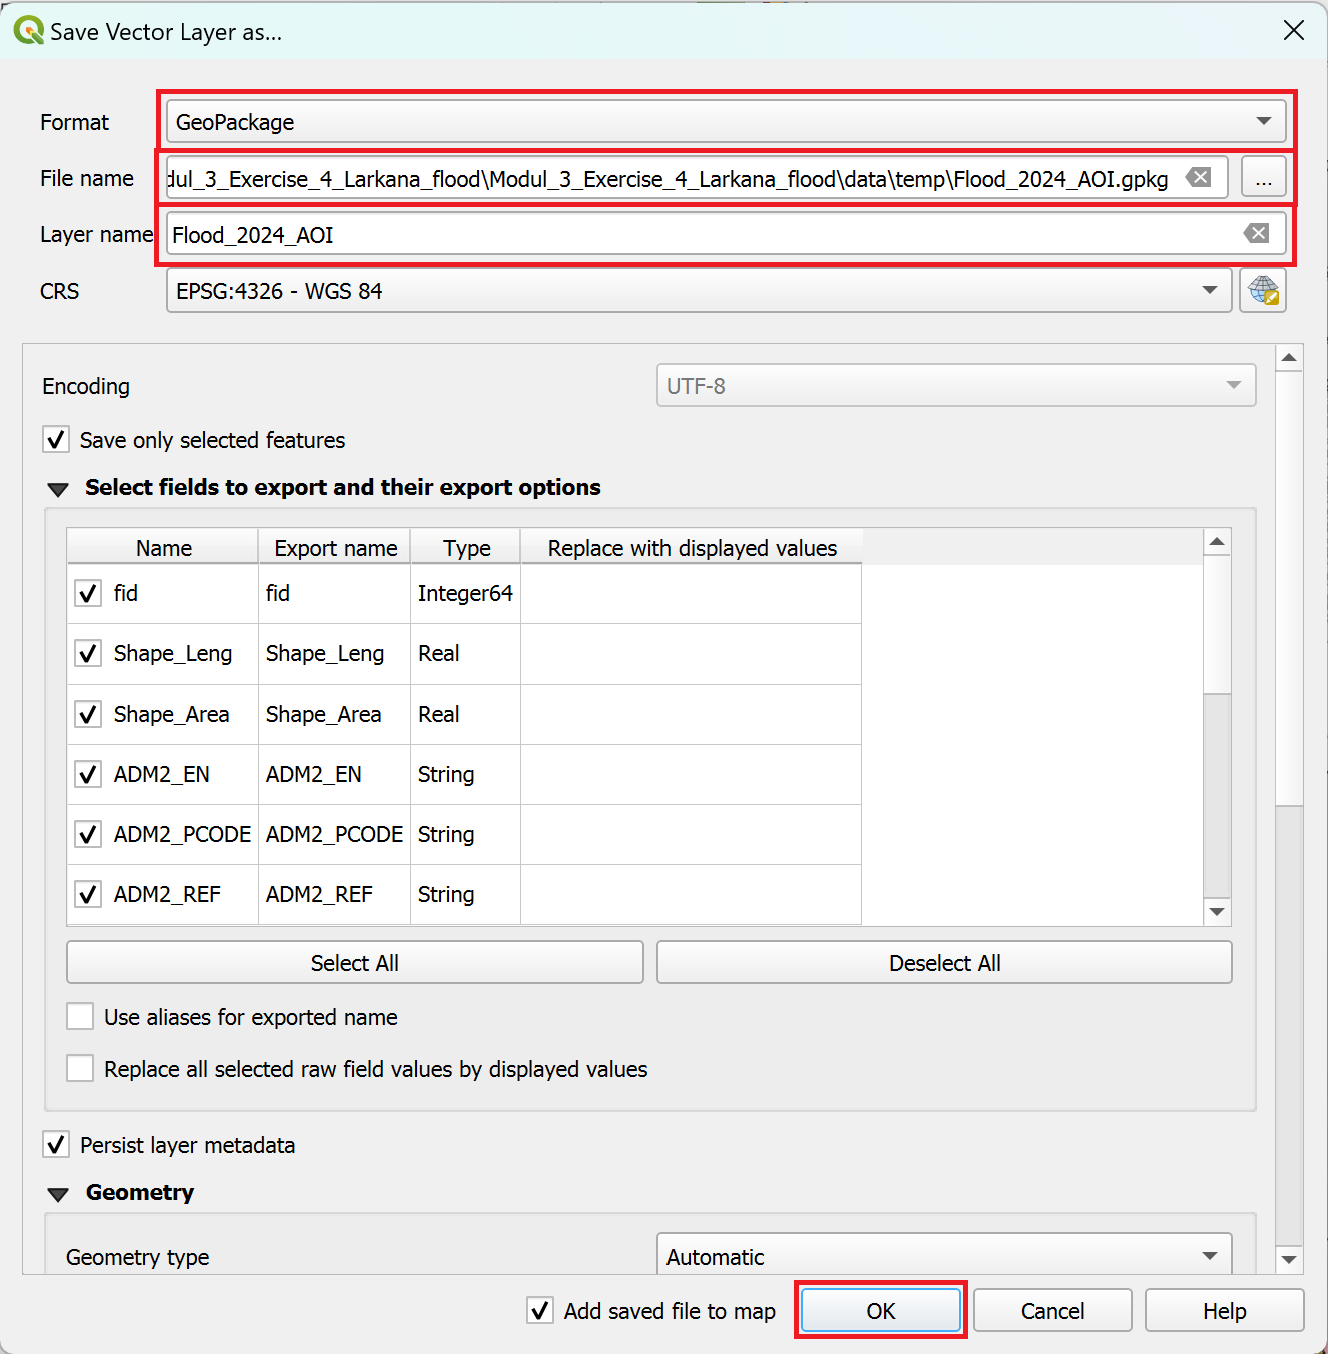
Make sure to save the geopackage in the correct location by clicking on the three dots to the right of the
File name-field.#Under
Format, select geopackage.To the right of the
File name-field, click on the three dots. Navigate to the folder with the exercise data and save it in thedata/temp/folder.Enter a layer name. For example, “Flood_2024_AOI”.
Click
OK. The exported layer should appear in your layers panel.
Task 2: Estimation of Flood Impact on the Health Sector in Larkana #
Context
Posts on social media have indicated a significant impact on the healthcare system in the region. You have been tasked to find out as much as you can about the situation and, if feasible, to estimate the impact on the health system.
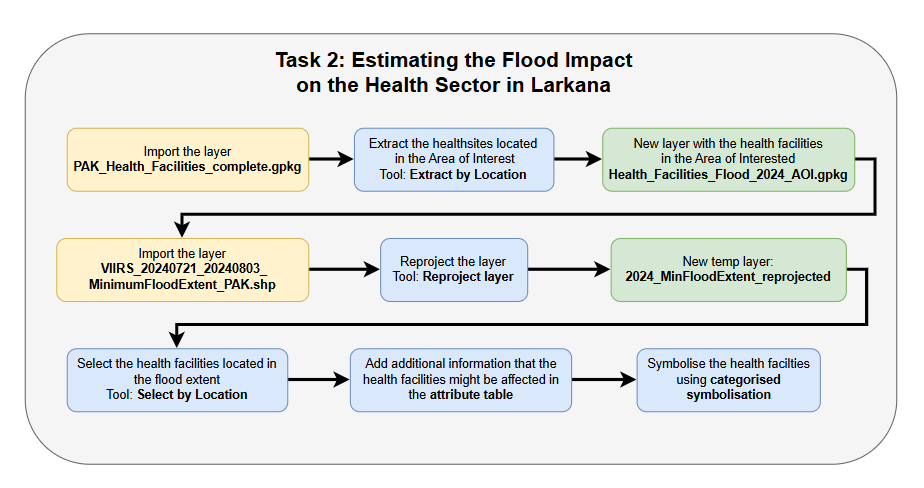
First, we need to find out where the health facilities are located in the area. We can find datasets by doing a quick search on the humanitarian data exchange (HDX). Here you can find the dataset “Pakistan Health Facilities (OpenStreetMap Export)”. We will be using this dataset. The dataset is already available in the download folder for this exercise.
Import the GeoPackage
PAK_Health_Facilities_complete.gpgkinto your project. You can either drag it onto the map canvas, or open the import window by clicking onLayer→Add Layer→Add Vector Layerin the top bar of QGIS (see wiki page). A new layer with point data will appear on your map canvas.Once we have imported the healthsites, we can extract those that are located inside of our Area of Interest. We can achieve this with the tool
Extract by Location.In the Processing Toolbox (opening the toolbox), search for the tool “Extract by Location”. Double-Click on it. A new window will open.
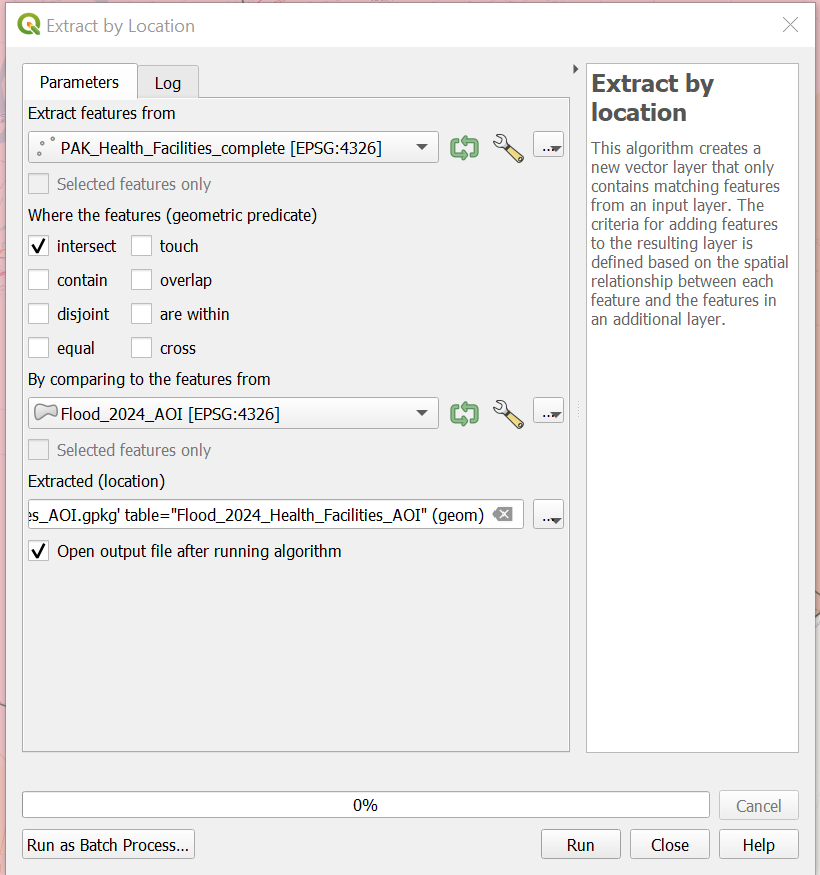
Extracting the health facilities in our Area of Interest using the tool “Extract by Location”.#
As
Input Layer, select the layerPAK_Health_Facilities_complete.The
Geometric predicateshould be set toIntersect.Under
By comparing to the features from, select the area of interest layer “Flood_2024_AOI”.Under
Extracted (location), click on the three dots and selectSave to Geopackage.Navigate to the
/Module_3_Exercise_5_Larkana_Flood/data/temp/-folder.Give the file the name “Health_Facilities_Flood_2024_AOI” and click
Save.You will be prompted to enter a layer name. Give it the same name as the file and click
OK.Click
Run. The new layer will appear in your layers tab.
Now we have an overview of the location of health facilities. However, we want to know which health facilities are impacted by the flood. Fortunately, the UN has just shared a dataset about the extent of floods from the 8th to the 12th of August, which we can overlay with our layer with the healthsites to identify the healthsites that are in the flooded area.
Import the dataset “VIIRS_20240721_20240803_MinimumFloodExtent_PAK.shp” into your QGIS project.
Once you have loaded the layers in QGIS, you can see that they are correctly displayed. However, upon checking the layer information, you can see that the new layers have a different Coordinate Reference System (CRS). They have the EPSG Code 9707 whereas our project has 4326 (Wiki Video).
Right-click on the layer and select
Properties. The properties window will open.
In the vertical tab bar on the left, navigate to
Information. Here you will find additional information about the selected dataset.
Under the headline “Coordinate Reference System (CRS)”, you can find all the information about the CRS. The most important are:
Name: Here you find the EPSG-Code.
Units: Here you find information about the units of measurements used in the dataset. For example, either meters or degrees.
This will be a problem as soon as we do something different then just displaying the layers. Since we want to manipulate the layers in the next step, we need to reproject them first (Wiki Video).
At the top of your QGIS-window, click on the
Vectortab →Data Management Tools→Reproject Layer, or search for the tool in theProcessing Toolbox.As
Input layerselect “VIIRS_20240721_20240803_MinimumFloodExtent_PAK.shp”.Select as target CRS/EPSG-Code 4326.
Save the new file in your
tempfolder by clicking on the three dots next to Reprojected, specify the file name as “2024_MinFloodExtend_reprojected”.Click
Run.Delete the old layer from the layer panel by right-clicking on the layer →
Remove layer.Adjust the opacity of the flood layer by right-clicking on layer “2024_MinFloodExtend_reprojected” in the Layer Panel and selecting
Properties. The properties window will open up with a vertical tab section on the left.
Navigate to the
Symbology-tab.Adjust the opacity to around 60% by moving the slider.
We have observed that certain health facilities have been impacted by the flood. In order to visualise this information on the map, we plan to include a new attribute called “Flood_affected” in the attribute table of “Health_Facilities_Flood_2024_AOI”. To accomplish this, we will select all the health facilities that are located inside the flood extent by using the tool “Select by Location”. In a next step, we will add a new column to the attribute table and add information into our selected healthsites.
Open the
Processing Toolbox(Wiki video) and search for the tool “Select by Location”.Select features from= “Health_Facilities_Flood_2024_AOI”.As
Geometric predicatewe useintersect.For
By comparing to the features fromwe use the layer “2024_MinFloodExtent_reprojected”.Modify current selection by=creating new selection.Click
Run.
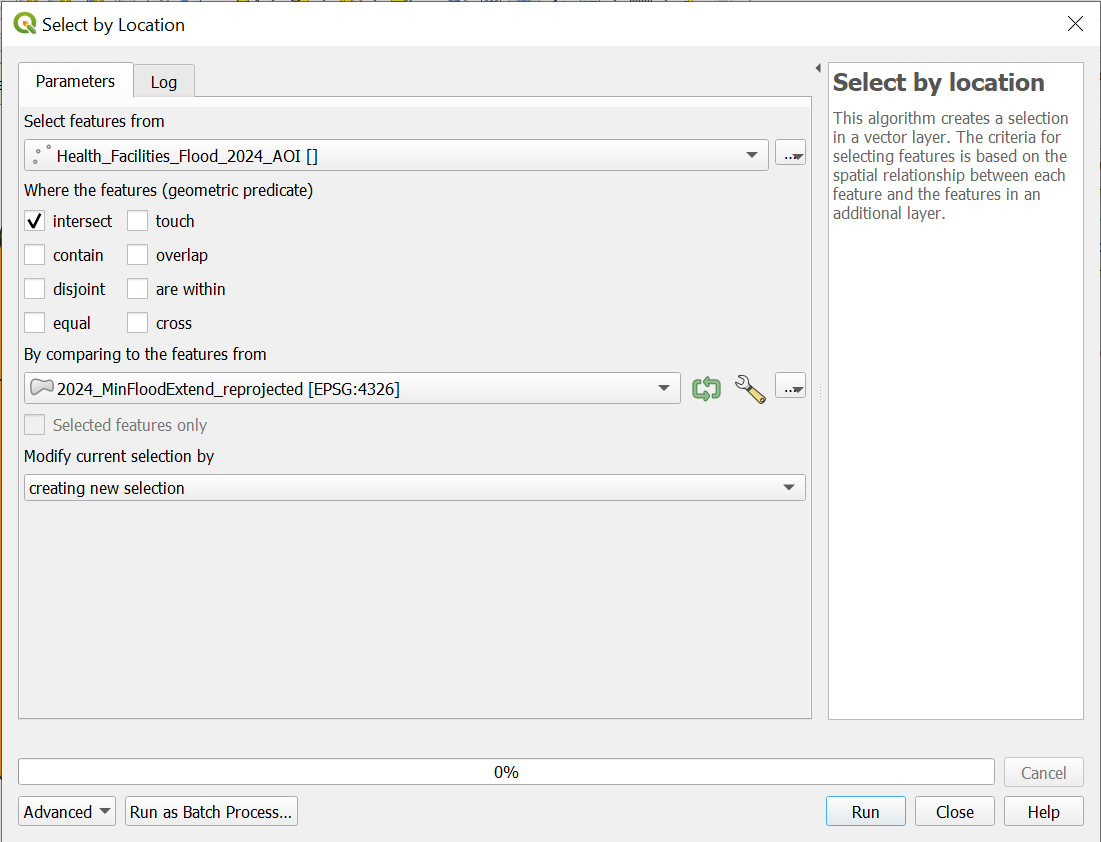
Selecting the flood affected health facilities using the tool “Select by Location”.#
Possible Error Message
In case you encounter the error:
Feature (1) from “2024_MinFloodExtend_reprojected” has invalid geometry.
Please fix the geometry or change the Processing setting to the “Ignore
invalid input features” option.
Execution failed after 0.07 seconds
You need to first use the tool “Fix Geometry” before repeating the previously failed step 5 of using the tool “Select by Location”.
To do so open the
Processing Toolboxand search for the tool “Fix Geometries”.Input layer=2024_MinFloodExtend_reprojectedSave the new file in your
tempfolder by clicking on the three dots, specify the file name as “2024_MinFloodExtend_reprojected_fix”.Click
Run.
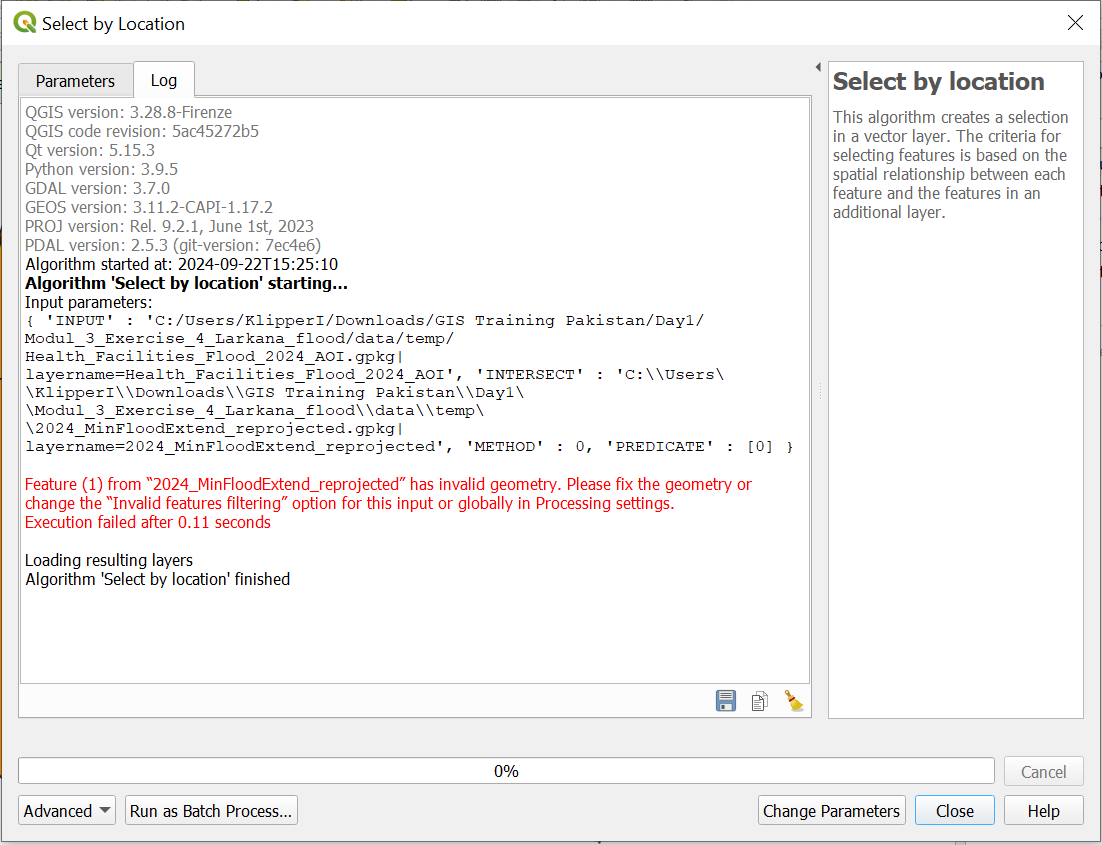
The error message indicating invalid geometries.#
We can edit the attribute table for the features that we have selected:
Open the attribute table of “Health_Facilities_Flood_2024_AOI” by right clicking on the layer →
Open Attribute Table(Wiki Video).Activate the editing mode by clicking on
 (Wiki Video). Now you are able to edit the data directly in the table.
We want to add a new column with the name “Flood_affected” to identify which healthsites are located inside of the flood extent. Click on
 . A new window will open.
In the
Add field-window, add the name of the column and specify theTypetoText (string)(Wiki Video).Click
OK.
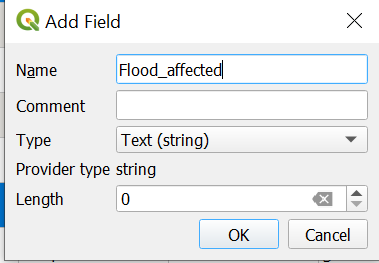
Adding a new column to the attribute table for the healthsites layer.#
Next, we want to edit the rows in the attribute table for the features we have selected.
Look for the
Show all Featuresoption in the lower left corner and click on it.Select the option
Show selected features(Wiki Video). This will filter the table to display only the rows that represent the health facilities directly impacted by the flood.Write
Yesin the “Flood_affected” column in each selected row.When you are done, click
 to save your edits and switch off the editing mode by again clicking on (Wiki Video).
Click on the icon
 in the toolbar to end the feature selection.
We can display the enriched dataset by visualising it using the categorised classification symbolisation method. This means that we select a column from the attribute table and use the values/content as categories to sort and display the data (Wiki Video):
In the layers panel, right-click on the layer “Health_Facilities_Flood_2024_AOI” and select
Properties. A new window will open up with a vertical tab section on the left.Navigate to the
Symbologytab.At the top of the window, there is a dropdown menu. Open it and choose
Categorized.Under
Value, select the column we added, “Flood_affected”.Further down in the window, click on
Classify. The unique values of the column “Flood_affected” should appear.You can adjust the symbolisation and colour of each value by double-clicking on each color in the table.
Once you are done adjusting the colours, click
Apply, thenOKto close the symbolisation window.
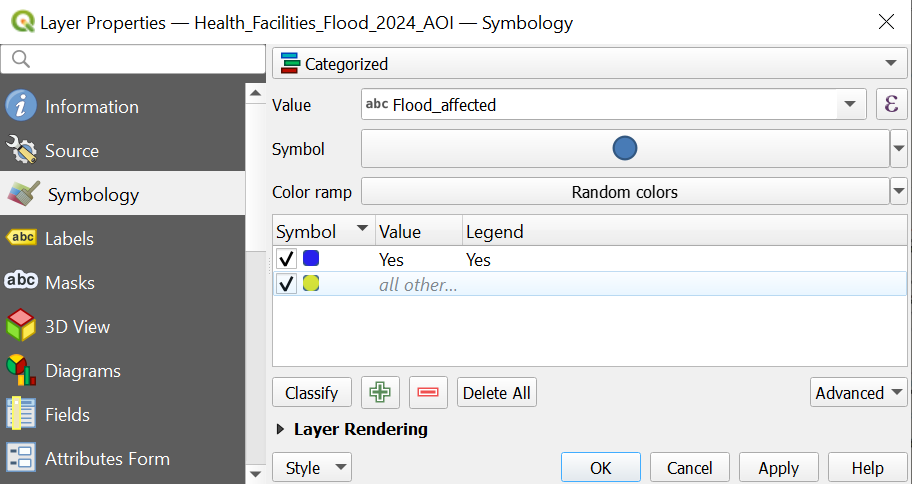
Classifying the flood affected health facilities.#
Achievement:
We’ve pinpointed the specific health facilities that have been inundated by the floods. Our findings indicate that a total of four facilities have been completely flooded and are currently non-operational. Considering we assessed the minimum flood impact, it’s highly probable that more health facilities will also be impacted. This data is crucial for our operational team as it will enable them to strategize and execute an effective response.
Task 3: Logistical access to Larkana City #
Context
The operations team is making plans to deliver much-needed supplies to the affected region around Larkana. Currently, there is uncertainty about how the supplies can be transported there. The operations team has asked for more information on this topic.
They need answers to the following three questions:
Which roads leading into Larkana are blocked, and at what specific locations are they blocked?
Are there any bridges that can be crossed from the eastern side of the Indus to the western side, and where are these bridges located?
If transporting supplies by road into the region is not feasible, what alternative method could be used to deliver the supplies?
In order to get a clearer picture, we need to import the road network data for the region into QGIS. Look for the file in the input folder. The road network is initially displayed without showing any road types or other relevant details. We should apply a categorized classification technique only to display the specific roads that we are interested in.
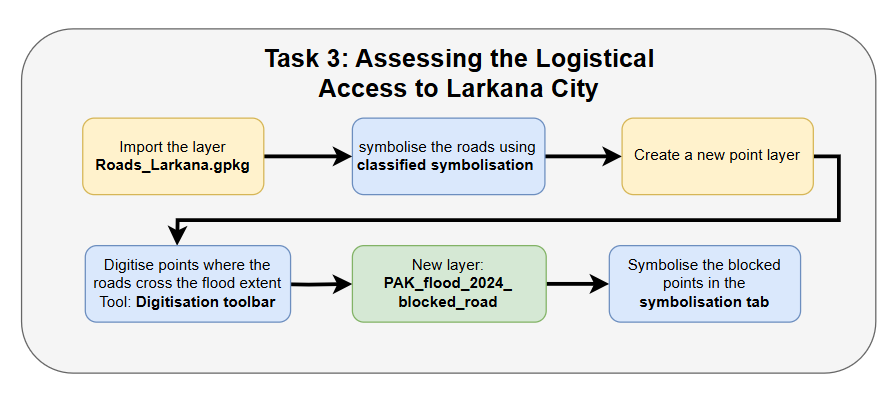
Load the dataset “Roads_Larkana.gpkg” from your input folder into your QGIS-project.
Lets set up the categorised classification. OpenStreetMap data distinguishes between different road types using the column “highway”.
Right-click on the layer “Roads_Larkana” and select
Properties. The properties window will open up.Navigate to the
Symbology-tab.At the top, select
Categorized(Wiki Video).Under
Value, select “highway”.Click on
Classify. You should see all the unique values for the “highway” column.Remove the ticks for all categories except for
motorway,primary,secondary, andtrunk.You can adjust the colours by double-clicking on the categories.
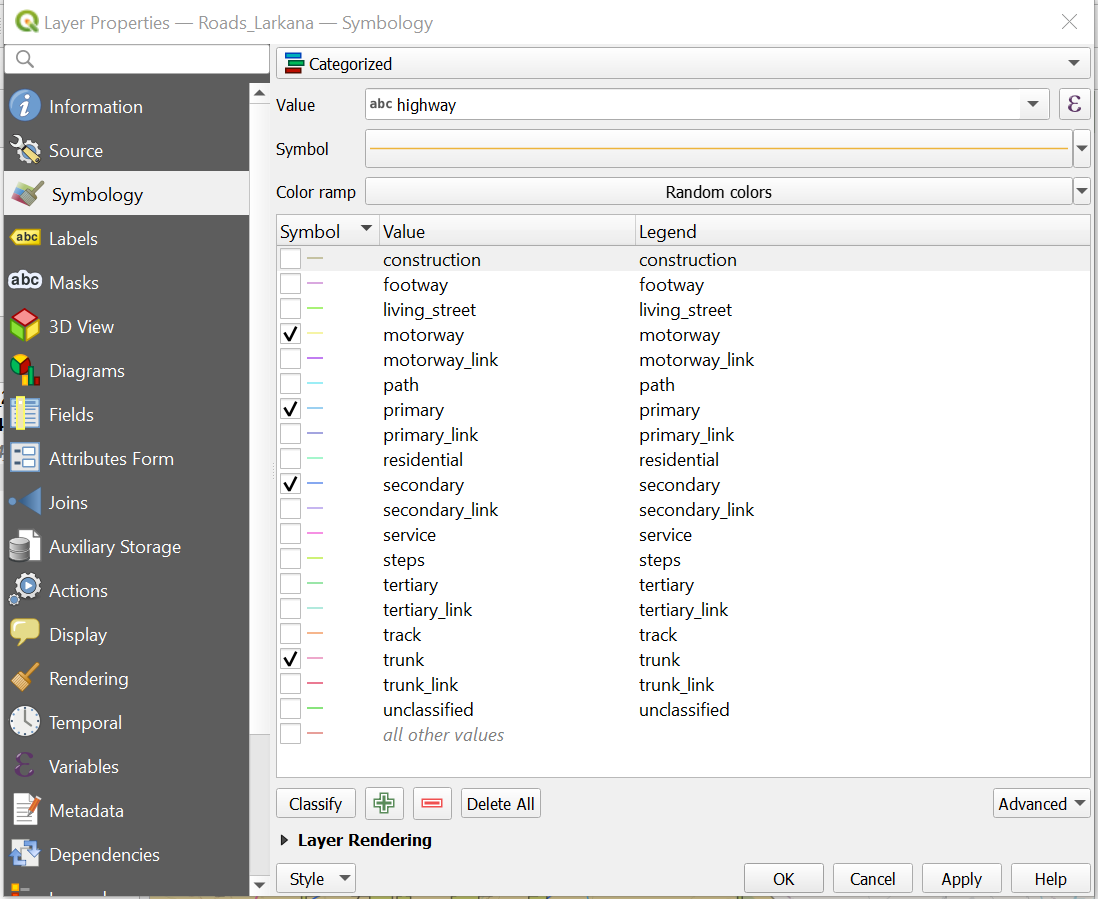
The symbolisation window for the Roads_Larkana.gpkg layer.#
You have the option to customize the width of the main roads’ lines to improve the visualization. Open the Symbology window, then select
Symbol. In the new window, you can adjust the width of the lines to your preference.
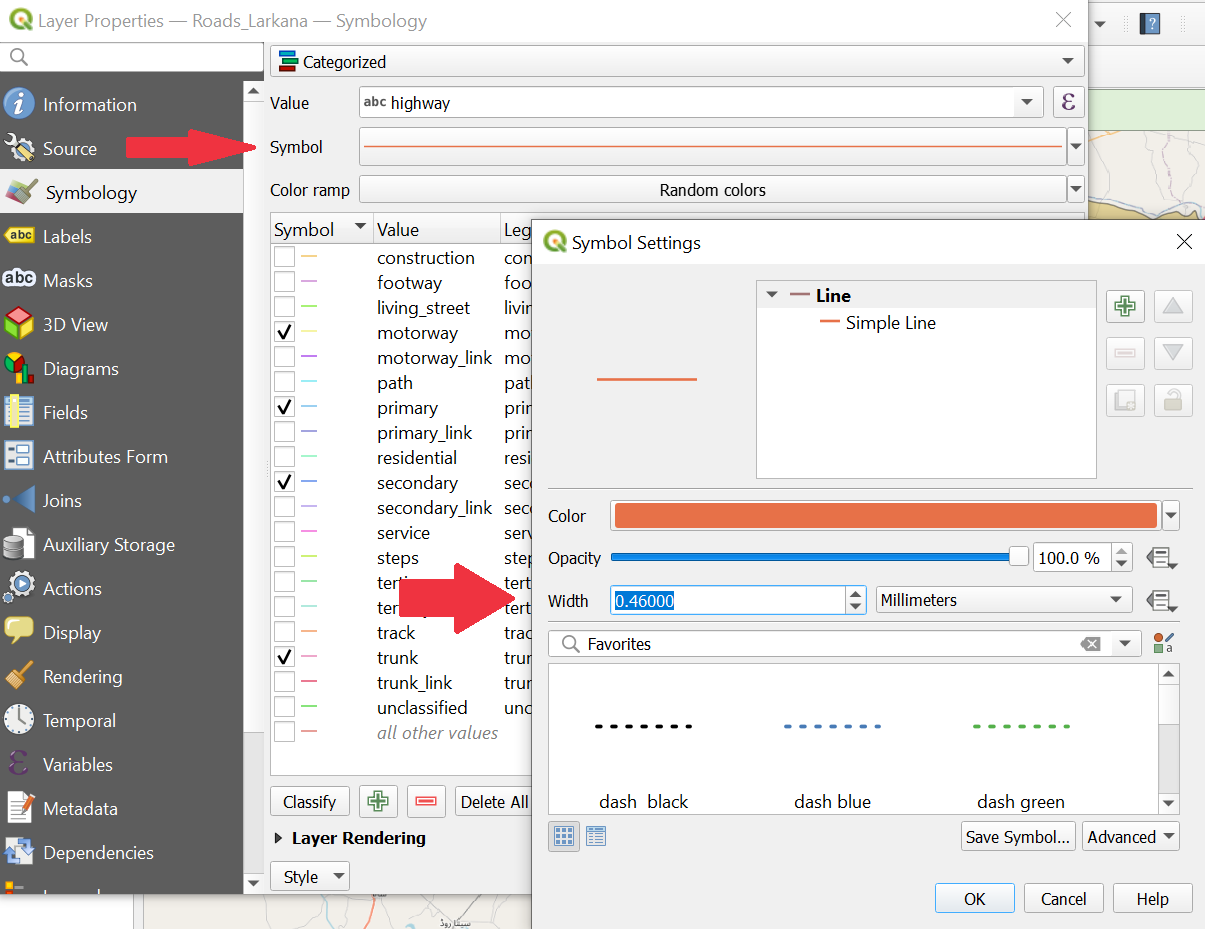
Adjusting the symbolisation of the different road types.#
Once you are done, click
ApplyandOKto close the symbology window.
Finally, we want to visualise the roads that are flooded. To simplify the process, we will manually search for the roads intersecting with the flood extent layer and mark them with points. For this purpose, we will create a new point dataset representing the blocked roads.
Click on
Layer→Create Layer→New GeoPackage Layer(Wiki Video)
Under
Databaseclick on and navigate to tempfolder. Give the new dataset the name “PAK_flood_2024_blocked_road”. ClickSave.Geometry type: SelectPointUnder
Additional dimensionyou should always make sure that you checkNone.Select the coordinate reference system (CRS) “EPSG:4326-WGS 84”. By default, QGIS selects the project CRS.
Under
New Fieldyou can add columns to the new layer. Add the column “Blocked_road”.Name= “Blocked_road”Type: SelectText(string).Click on
Add to Fields List to add the new column to the Fields List.Create another field with the
name“Blocked_bridge” and theType: SelectText(string).Click
OK.
Your new layer will appear in the layers panel.
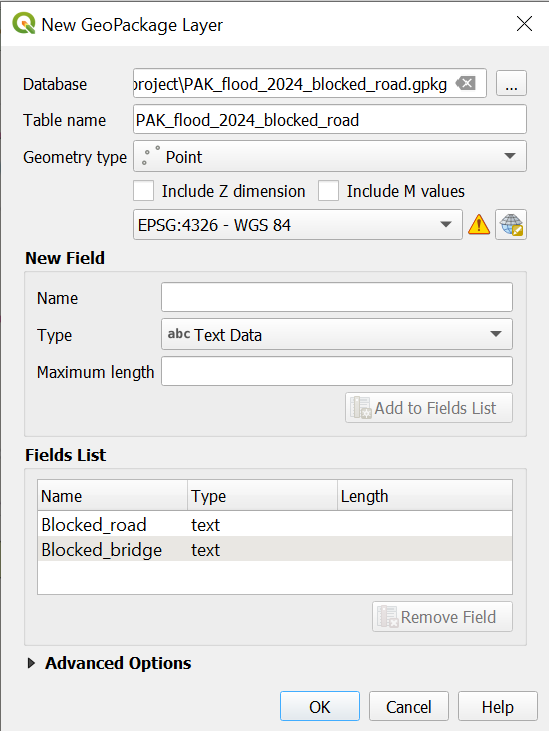
Creating a new point layer. Make sure to specify a location using the three points at the top.#
Now you can create a point for each place where the flood layer covers the main roads leading out of Larkana (Wiki).
Currently the new layer “PAK_flood_2024_blocked_road” is empty. To add features we can use the
Digitizing Toolbar.
Activate the editing mode by clicking on
. Next, activate the option to add new points by clicking on 
Add Point Feature.Look out for places where the flood layer covers the main roads or bridges leading out of Larkana. Once you have found one, left-click on the location you want to digitise.
Once you click on a place, a window will appear. Indicate that the road is blocked by writing
Yesin the fieldBlocked_road.Repeat this step with all the locations your can find.
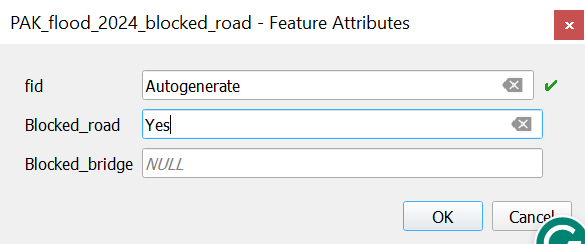
This pop-up will open once you have selected a location to add a point. Make sure to enter the relevant information in the columns.#
Once you are done with digitizing click on
to save your edits.Click again on
to end the editing mode.
Now, we have mapped all blocked main access roads into Larkana. We can use icons instead of just points to display the layer “PAK_flood_2024_blocked_road” to visualise this fact better (Wiki).
Right-click on the layer “PAK_flood_2024_blocked_road” in the Layer Panel and click on
Properties. A new window will open up with a vertical tab section on the left. Navigate to theSymbologytab.Keep the
Single Symboloption. Select any symbol from the list that is appropriate for marking blocked roads.Once you are done, click
ApplyandOKto close the symbology window.After you are done, click on the icon
to end the feature selection mode.
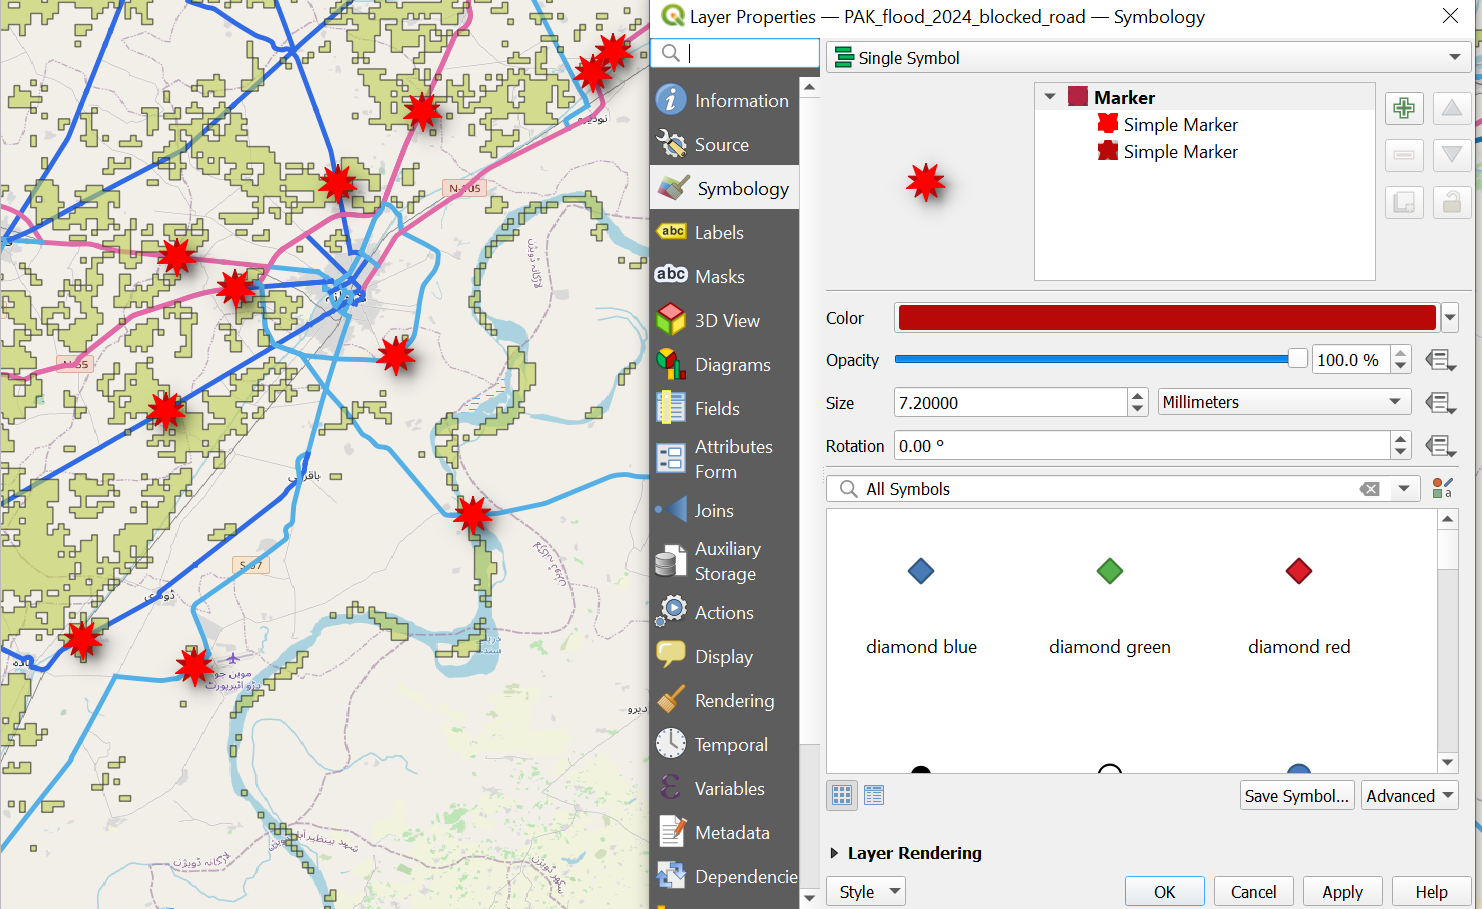
Adjusting the symbolisation for the new point layer. Make sure to choose a marker that can be easily identified.#
Part of your assignment was to point out possible alternatives to road transport. Can you identify any?
Answer
In the south-west of Larkan City, you can find the Mohenjodaro Airport. Currently, the road from Larkana City to the airport appears to be open and accessible. This means that essential supplies could potentially be transported from the airport into the city without encountering any roadblocks.
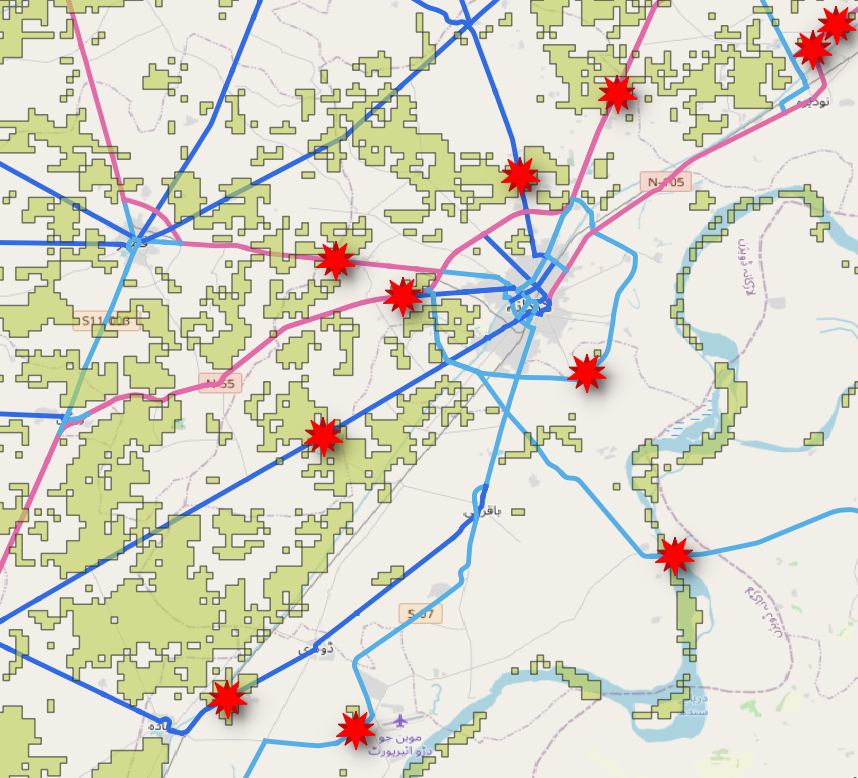
Road access to Mohenjodaro Airport#
The operations team has now all the information they need to plan their logistics. Good Job!
Continue along this exercise track
This exercise is part of the Larkana Flood Response Exercise track and continues with an exercise in module 4.
Click here if you want to continue to the next exercise of this exercise track.