Exercise 3: Data sources #
Characteristics of the exercise #
Aim of the exercise:
The aim of this exercise is to navigate various data sources, gain an understanding of where and how to access relevant data, and identify potential problems. It is important to use reliable, up-to-date, and appropriate data sources that fit the purpose of the analysis to ensure a successful and meaningful results. Always consider your analysis objectives and requirements and search for data accordingly.
Larkana Flood Response Exercise Track
This exercise is part of the Larkana Flood Response Exercise Track.
Competences covered in this exercise
QGIS essentials
Finding and downloading relevant datasets and preparing them for further analysis
Data literacy
Estimated time demand for the exercise:
The exercise takes around 1 hour to complete, depending on the number of participants and their familiarity with computer systems.
Relevant Wiki articles and module chapters
Instructions for the trainers #
Trainers Corner
Prepare the training:
Take the time to familiarise yourself with the exercise and the provided material.
Prepare a white-board. It can be either a physical whiteboard, a flip-chart, or a digital whiteboard (e.g. Miro board) where the participants can add their findings and questions.
Before starting the exercise, make sure everybody has installed QGIS and has downloaded and unzipped the data folder.
Check out How to do trainings? for some general tips on training conduction
Conduct the training
Introduction:
Introduce the idea and aim of the exercise.
Provide the download link and make sure everybody has unzipped the folder before beginning the tasks.
Follow-along:
Show and explain each step yourself at least twice and slow enough so everybody can see what you are doing, and follow along in their own QGIS-project.
Make sure that everybody is following along and doing the steps themselves by periodically asking if anybody needs help or if everybody is still following.
Be open and patient to every question or problem that might come up. Your participants are essentially multitasking by paying attention to your instructions and orienting themselves in their own QGIS-project.
Wrap up:
Leave time for any issues or questions concerning the tasks at the end of the exercise.
Leave some time for open questions.
Exercise #
Available Data #
Download the data and project file for this exercise here and unzip the folder.
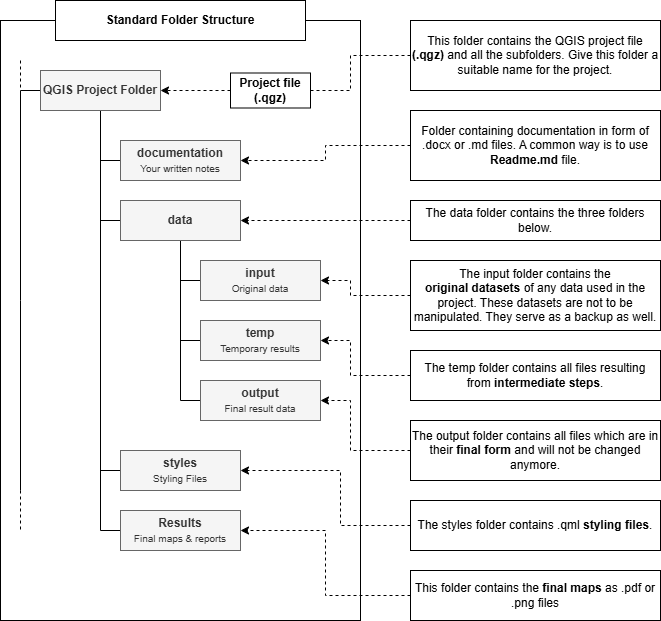
Standard folder structure
Task 1: Download the administrative boundaries and healthsites for Pakistan #
For our flood response map, we will need a few datasets from the web. In this exercise, we will be looking for the administrative boundaries of Pakistan, the healthsites, as well as the flood extent of the flood in Pakistan in 2024. First, let us set up a new QGIS project along with the standard folder structure:
Download the folder structure and unzip it.
Create a copy of the folder structure and name the folder
module_2_exercise_3_data_sources.Open a new QGIS project and save it into the folder.
Now that we have the QGIS project set up, we can start looking for the datasets
Find a data source to download the administrative boundaries and healthsites of Pakistan. The following instructions are designed for the example of Pakistan. If you wish to perform the same analysis for another country, some instructions may differ, but the general workflow will remain the same.
Possible data sources
There are many different data repositories on the web where you can find suitable data. You can find a list of possible data sources here.
For most humanitarian data, you can search on the Humanitarian Data Exchange/HDX The Humanitarian Data Exchange (HDX) is a primary platform for accessing and sharing geospatial data relevant to humanitarian crises. It’s a centralized repository offering a wide range of datasets from various sources, making it an invaluable resource for aid organizations and researchers.
Which data format to choose
Most datasets on HDX are available in various dataformats such as xlsx, csv, shapefile, or GeoJSON. We are looking for spatial data that we can use in QGIS, so we will need a spatial data format such as .shp (Shapefile), .gpkg (GeoPackage), .geojson (GeoJSON), or .gdb (GeoDatabase)
Download the data and save the administrative boundaries and the healthsites into the
data\inputfolder.
Note
Make sure to only use the point data from the healthsites dataset. Other data shapes such as lines or polygons can be ignored in this example. Depending on the data source, information can be provided as points, but also as lines or polygons.
Now add the OpenStreetMap basemap via the browser window →
XYZ Tiles. Adding basemaps can help you orient yourself, gain a better understanding of the area of interest, and create more informative maps.Familiarise yourself with the data by opening the attribute table and identify the different types of healthcare that are included in the dataset. Get an overview of the information that is stored in each column. For example, there could be information indicating the type of healthsite.
If your dataset contains information about the type of healthsite (e.g. clinic, hospital, doctor, etc.), we can extract these and save them in a new layer. We can do this by selecting the hospitals and then copying them to a new layer.
Hint
For information on how to easily filter your data by manually selecting features in the attribute table after it has been sorted based on a particular column, see the attribute table page on the wiki.
Task 2: Download the flood extent for Pakistan for August 2024 #
Now, let us download the flood extent for Pakistan from the 8 to 12 August 2024.
Go back to the humanitarian data exchange and search for “Pakistan Flood”. You will find a list of datasets containing the satellite detected water extents for different periods.
Choose the dataset with the title “Satellite detected water extents from 08 to 12 August 2024 over Pakistan” and download the zip-folder.
Unzip the folder and look at it’s content. There are a few different shapefiles. We are looking for the minimum flood extent. Locate the files called
VIIRS_20240721_20240803_MinimumFloodExtent_PAKand copy them to thedata\input-folder.
Working with shapefiles
Shapefiles consist of several files (.shp, .shx, .sbx, .sbn, .prj, cpg). In order to copy the entire shapefile to the new location, make sure to copy all the files with the exact name to the new folder.