Mapping Saturation
The Mapping Saturation indicator provides a measure of completeness. It analyses how the growth of mapped features in OSM approaches a natural maximum over time.
Result
Methods and Data
Intrinsic approach
The central assumption behind mapping saturation is that every feature has a finite extent in reality. As mapping activity increases, the number or length of newly added features per time step decreases, and the cumulative growth curve gradually saturates towards the true value. To estimate this saturation level, we use the historical development of OSM contributions and fit non-linear regression models to the cumulative growth curve. The workflow for the Mapping Saturation indicator consists of four main steps.
The temporal development of the OSM data is extracted for the selected feature class and aggregated in monthly intervals starting from 2008.
The cumulative time series of mapped features is fitted using a non-linear regression approach with various logistic growth models.
The best-fitting model is selected based on statistical error criteria.
The asymptote of the fitted model is used to approximate the maximum number of mappable features, and completeness is calculated as the integral of the actual OSM data relative to the fitted saturation curve over the last 3 years, normalised to a range of 0 to 1.
This results in three quality levels:
Not saturated (<0.3)
Ongoing mapping (0.3 - 0.97)
High saturation (> 0.97)
Examples
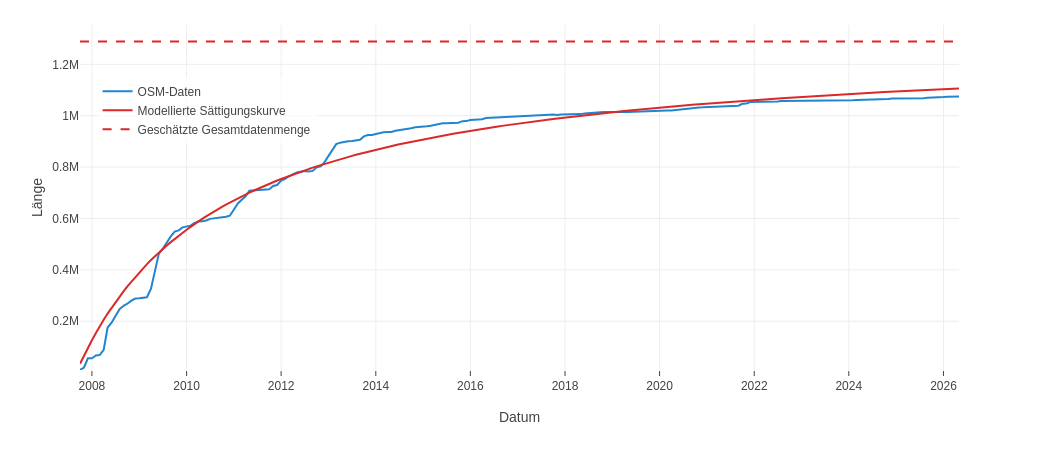
A good example of the expected mapping trajectory can be seen here. Here, Roads (all highways) were examined in Ansbach. More and more data was added over the years. Between 2008 and 2010, a large amount of road length was mapped in a short period of time. After that, less new road length was gradually added over time, but continuous mapping is still visible, gradually approaching saturation. We can assume that mapping of roads in Ansbach is essentially complete, with only minor corrections still being made.
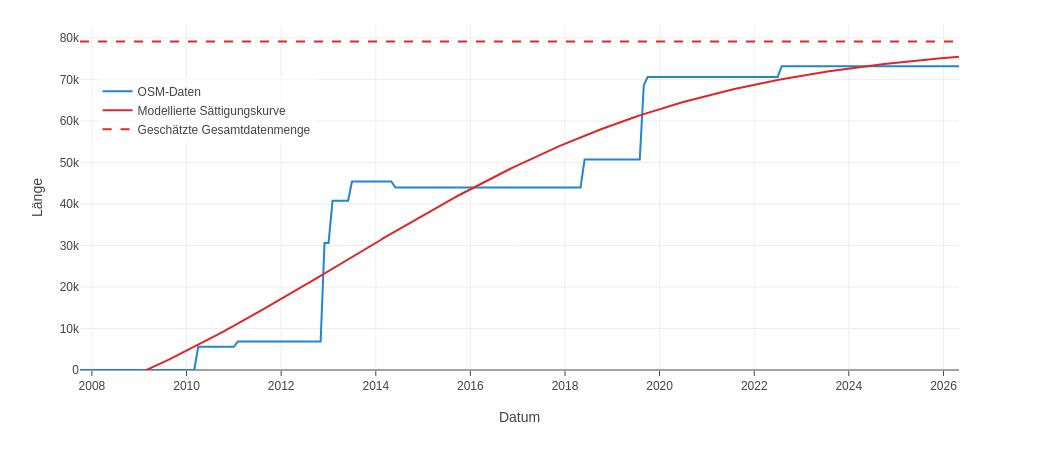
In the example below, mapping saturation was calculated for Roads (cars) for a region in Tunisia. Here you see a differently shaped saturation curve. Data wasn’t added continuously and gradually towards saturation, but in individual bursts, producing a step-like shape. These bursts can have different causes: they could reflect actual new road construction, but it’s more likely that they represent individual mapping events, where large numbers of new roads were mapped within a short period of time. Whether some roads are still missing before the area is fully mapped, or whether all roads have already been covered by these bursts, can’t be determined from the data alone. The correctness of the quality assessment therefore can’t be clearly confirmed.
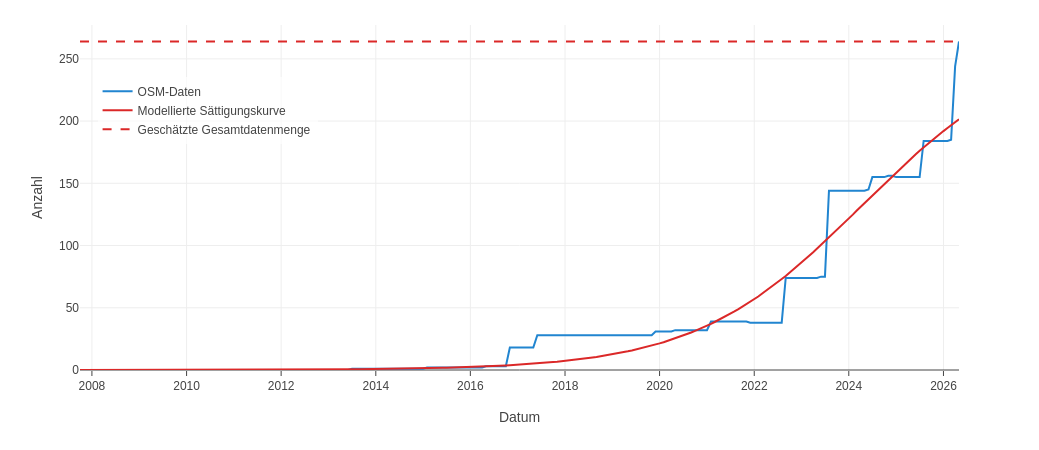
The following example shows that the “ongoing mapping” quality assessment can indeed be correct. Trees (Custom Topic) in Dossenheim were examined. Here too, a step-wise increase in data can be observed, although at noticeably shorter intervals. Large numbers of new trees were also added quite recently. As a result, the maximum number of trees assumed by the saturation curve has already been reached. We can assume that the mapping process is still ongoing here, and that the indicator’s quality assessment isn’t correct.
References
Gröchenig S et al. (2014): Digging into the history of VGI data-sets: results from a worldwide study on OpenStreetMap mapping activity Gröchenig et al. (2014)
Barrington-Leigh C and Millard-Ball A (2017): The world’s user-generated road map is more than 80% complete Barrington-Leigh & Millard-Ball (2017)
Josephine Brückner, Moritz Schott, Alexander Zipf, and Sven Lautenbach (2021): Assessing shop completeness in OpenStreetMap for two federal states in Germany Brückner et al. (2021)
- Gröchenig, S., Brunauer, R., & Rehrl, K. (2014). Digging into the history of VGI data-sets: results from a worldwide study on OpenStreetMap mapping activity. Journal of Location Based Services, 8(3), 198–210. 10.1080/17489725.2014.978403
- Barrington-Leigh, C., & Millard-Ball, A. (2017). The world’s user-generated road map is more than 80% complete. PLOS ONE, 12(8), e0180698. 10.1371/journal.pone.0180698
- Brückner, J., Schott, M., Zipf, A., & Lautenbach, S. (2021). Assessing shop completeness in OpenStreetMap for two federal states in Germany. AGILE: GIScience Series, 2, 1–7. 10.5194/agile-giss-2-20-2021