Land Cover Completeness
The Land Cover Completeness indicator calculates the percentage of the total area that’s covered by OSM land cover data.
Result
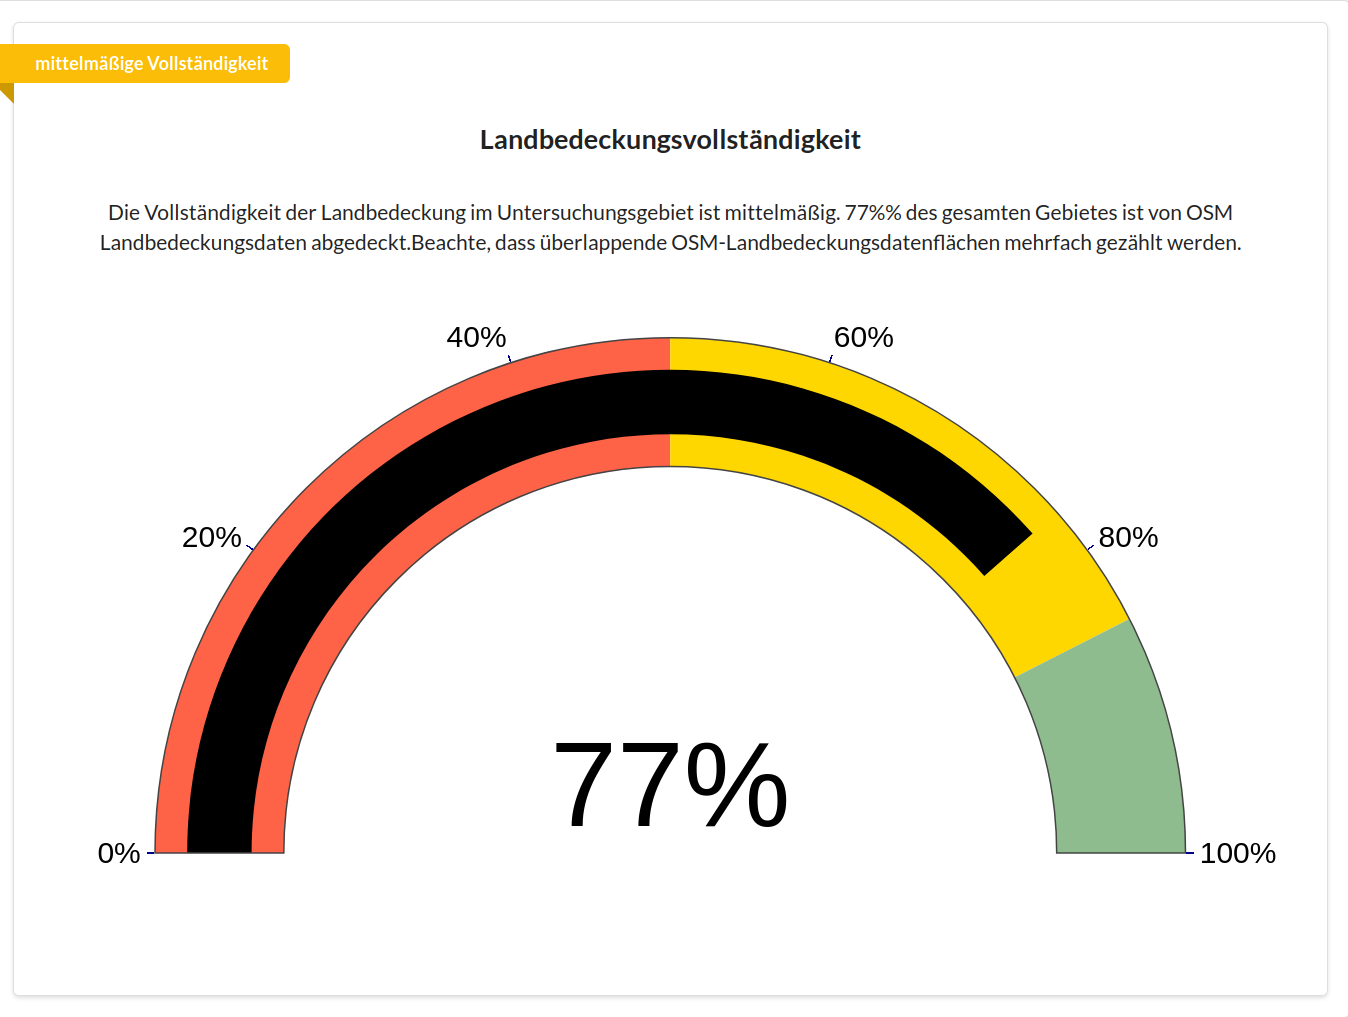
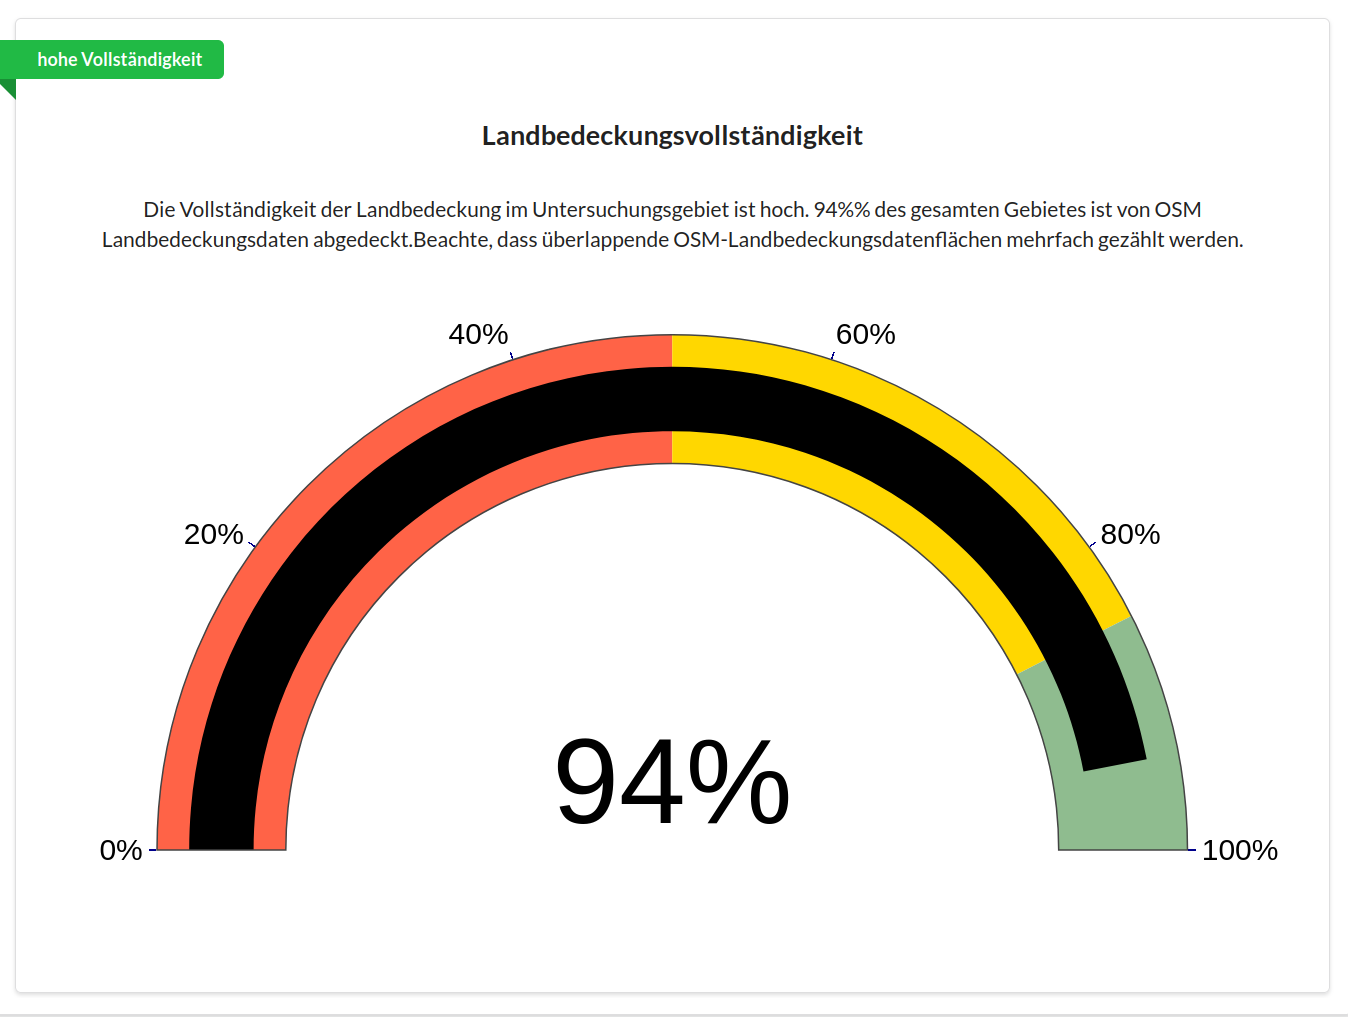
You’ll find the results of the query in the result log below. The chart shows the percentage of the chosen area that’s covered by OSM land cover data. The green, yellow or red banner in the top left shows the land cover completeness.
Methods and Data
Intrinsic approach
The Land Cover Completeness indicator quantifies the share of an area of interest (AOI) that’s covered by OSM land cover data. It’s calculated intrinsically as the ratio of the summed area of OSM land cover polygons to the total area of the area of interest, normalised to a range of 0 to 1.
There are three quality categories:
Low completeness < 50%
Medium completeness 50% - 85%
High completeness > 85%
This indicator is only available for the topic Land Use and Land Cover. It covers all OSM tags that define land cover and land use, such as built-up areas, forest or inland waters. A detailed list of the filters for all OSM tags used can be found in the topic definitions.
Examples
Here we see the land cover completeness of Bonn. At 94%, Bonn has high completeness.
This figure shows the land cover completeness of a rural area near Hanover. At 77%, completeness is classified as medium.