User Activity
This indicator calculates how many unique users have contributed to a given topic, grouped by month.
Methods and Data
Intrinsic method
The monthly number of unique users who edited a given topic within the area of interest is determined for the entire history of OSM. In addition, the median for the last 3 years is calculated, and a regression line is fitted to show the current trend in user activity.
User Activity assesses the engagement of contributors within the area of interest, and doesn’t provide direct information about data quality. Combined with other indicators, however, and by looking at absolute values and regression trends, it can offer insight into the sustainability of the OSM community.
Example
This indicator doesn’t provide direct information about the quality of OSM data, but it can still help draw conclusions about it.
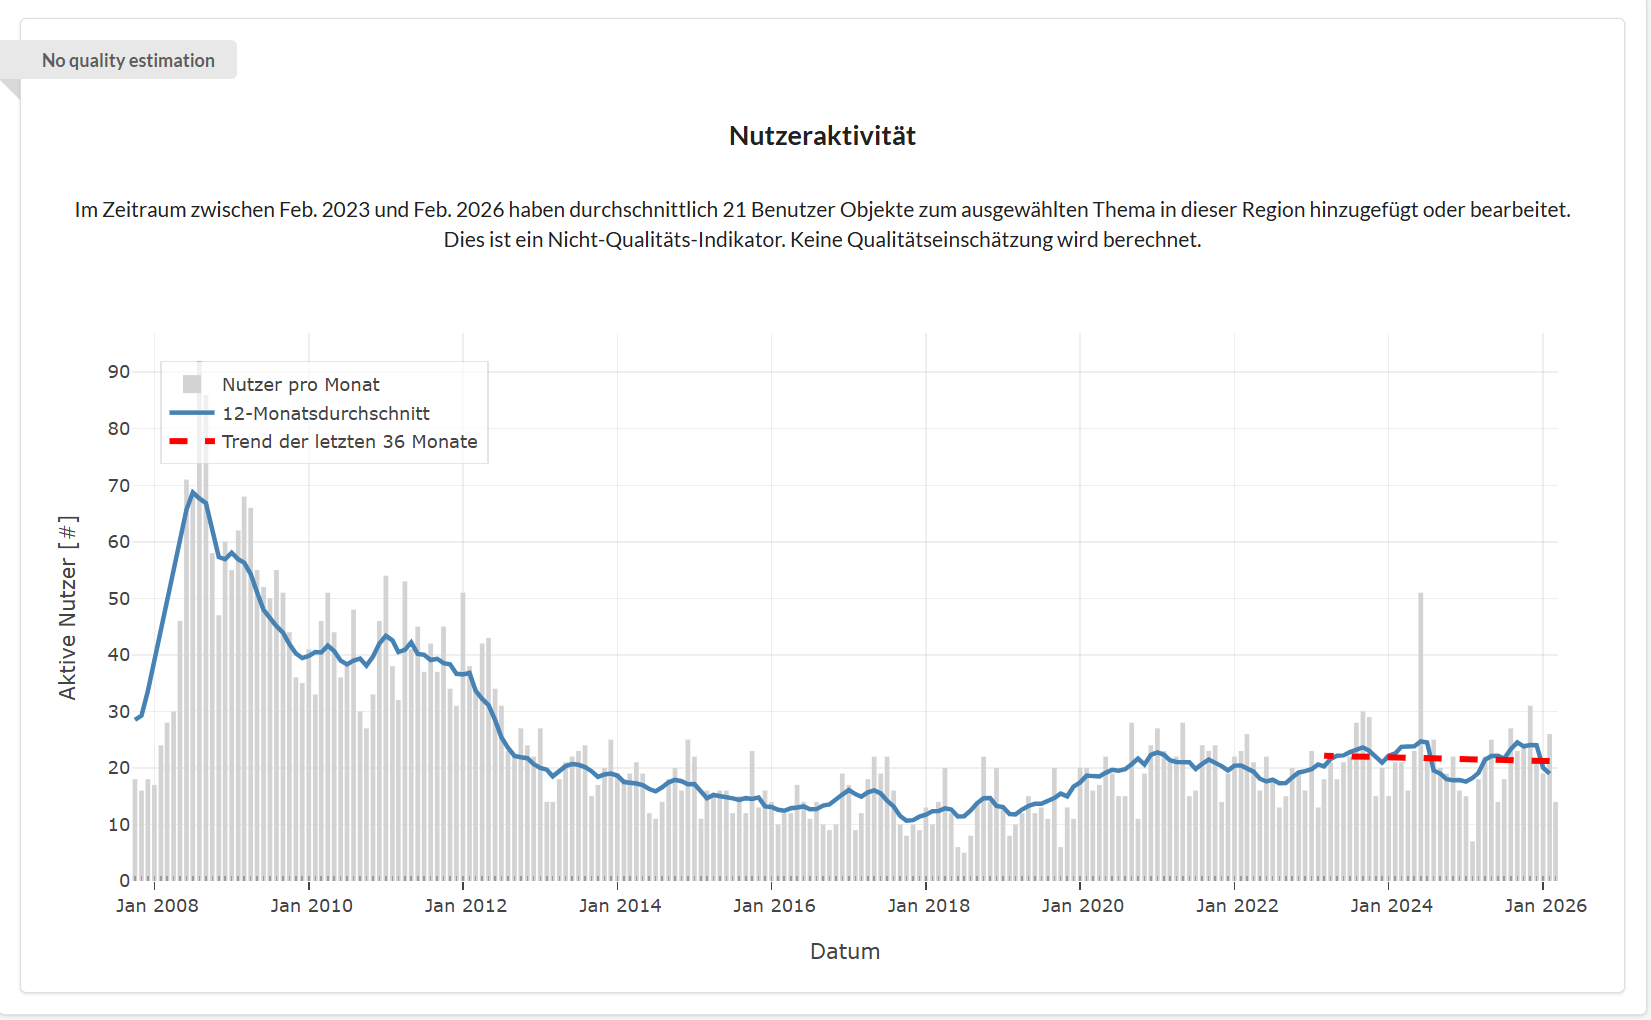
The chart above, showing user activity in Heidelberg for the topic Roads (cars), shows for example that user activity in recent years has been fairly stable at around 20, and has risen slightly over the last 10 years.
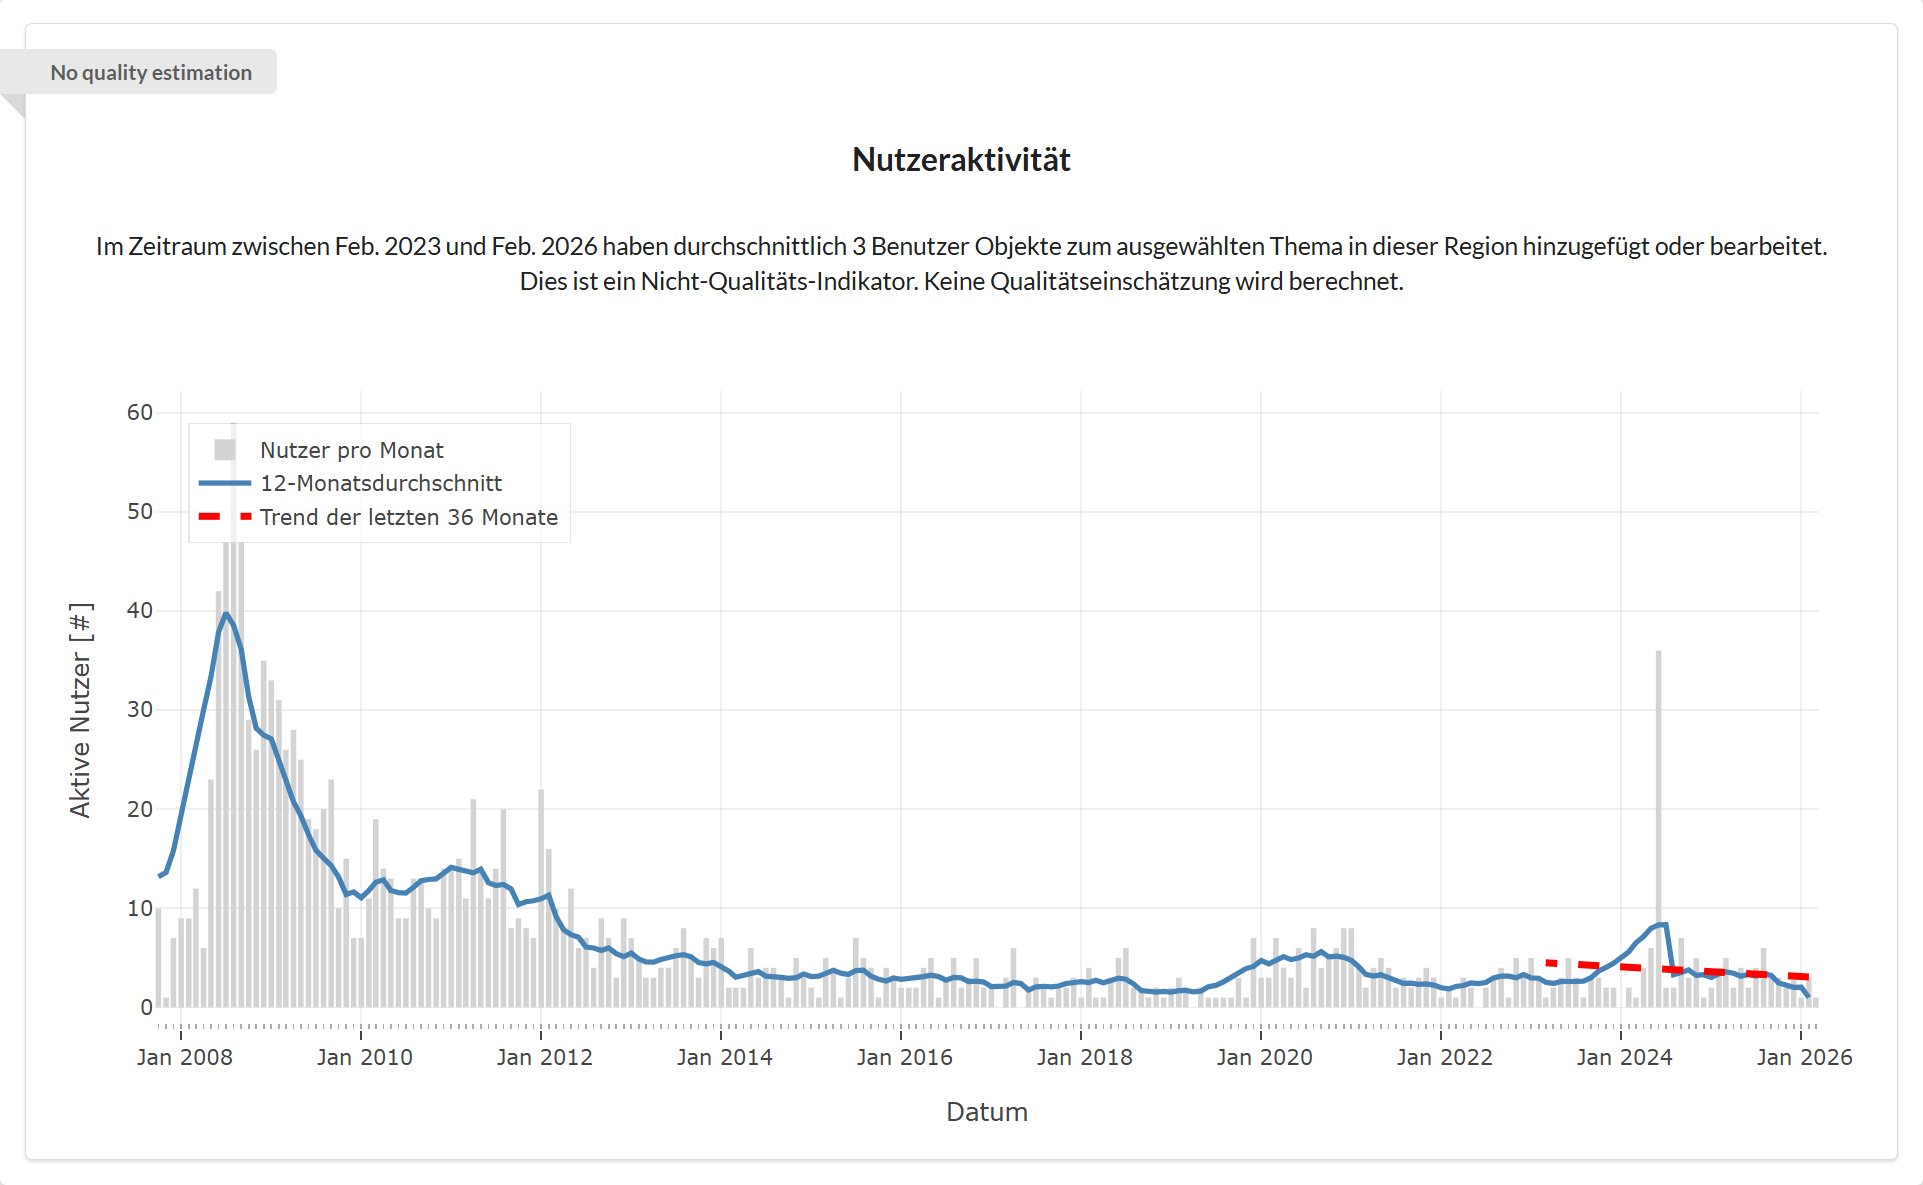
For a similarly sized region in the Odenwald (chart below), user activity is noticeably lower, at only around 3 monthly users. Here too, this figure isn’t a clear indicator of data quality. At lower user numbers, however, the mapping preferences of individual users become much more relevant
for example, how many semantic attributes are added. This indicator can also be used to compare mapping activity across different regions and topics.